After posting an article in rememberance to my friend Jim Sleep of Western Michigan University, I was fortunate to be contacted by WMU. They had found my article, and they were looking for more information about Jim. I came up with a few stories from back in the day and recalled having a cardboard tube of pen plots from that period. After digging through 45 years of stuff, I found them!
I couple of the plots are made with the Zow algorithm that Jim wrote, and I’ll point these out, but most are not.
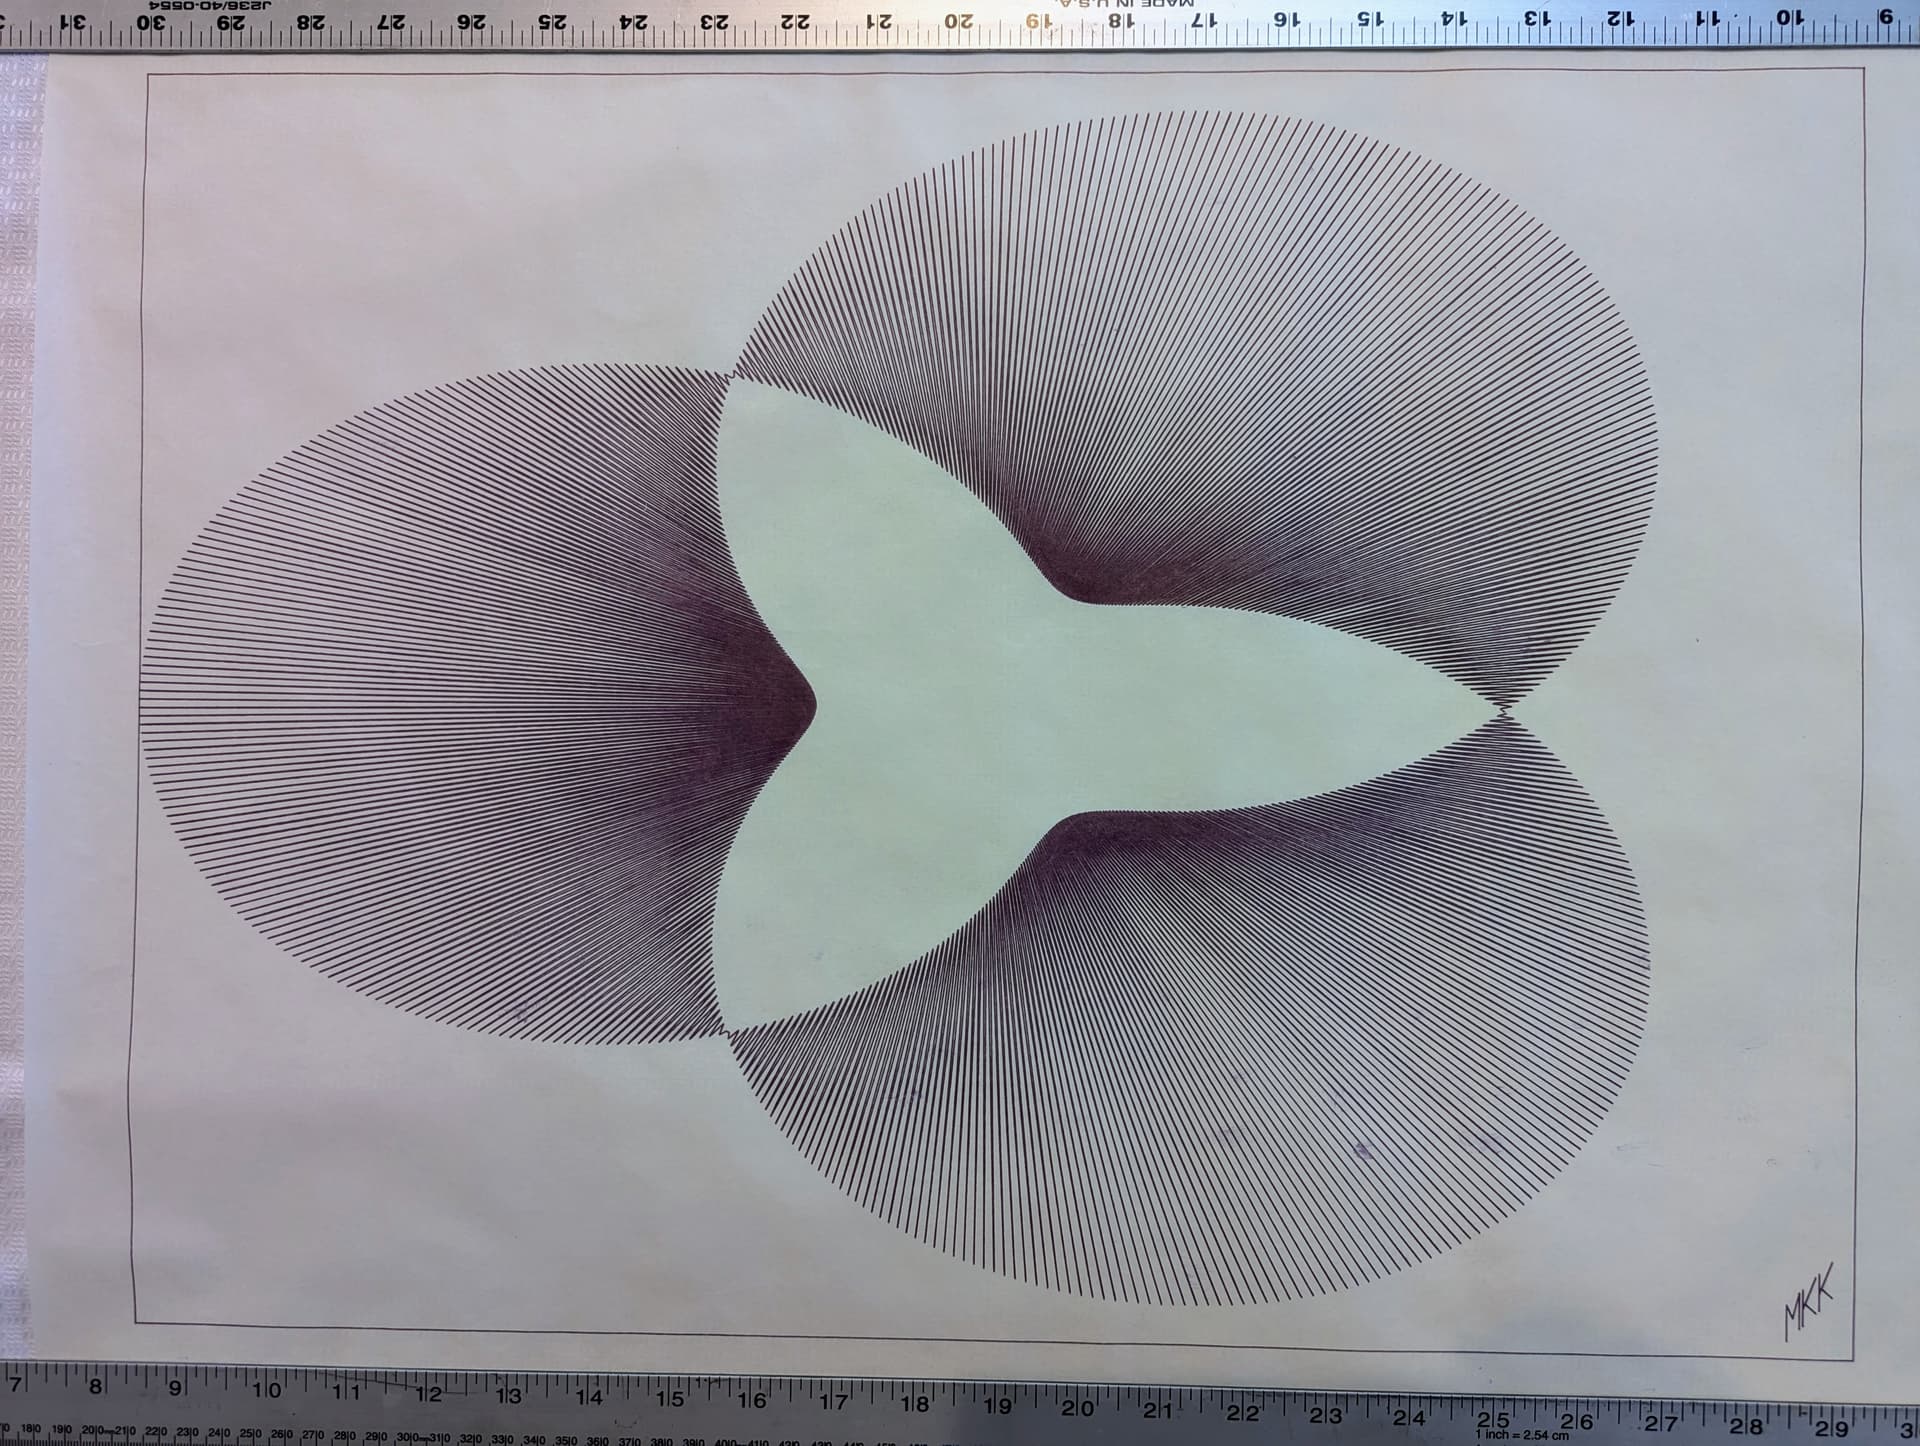
This first one was inspired by the cover of a book on mathematics, linear algebra if I recall correctly. With access to a large graphics tablet, I digitized the outline of a human head. From there I wrote a bit of Fortran to transform a square into the human head and back to a square again.
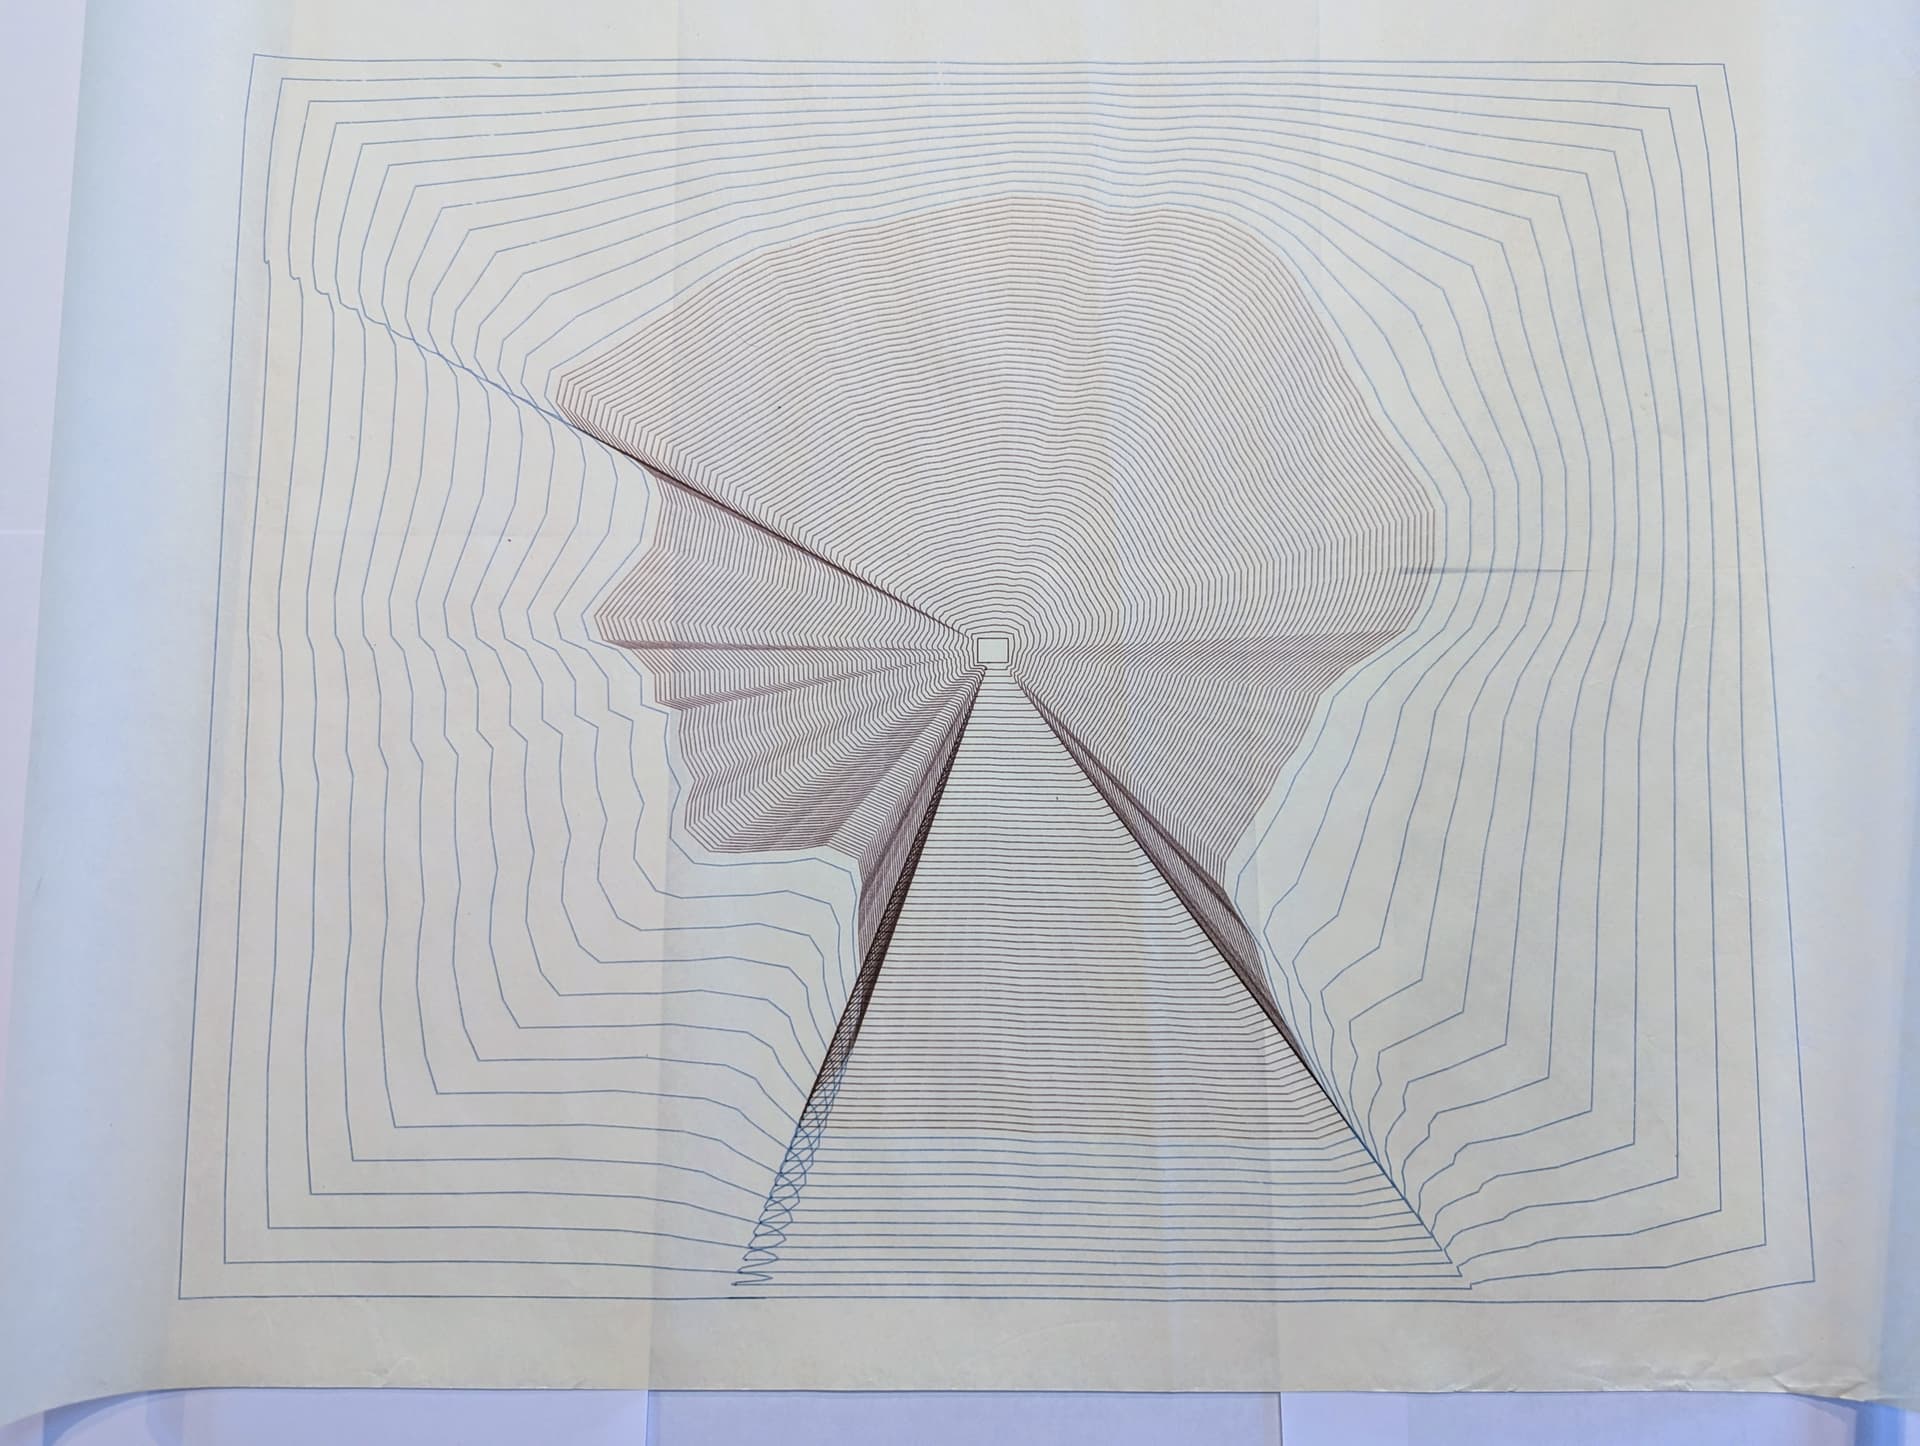
Another version of this plot, is the outline of the Michigan mitten, was on the cover of the WMU Computer Fair, quite possibly in the fall of 1981.
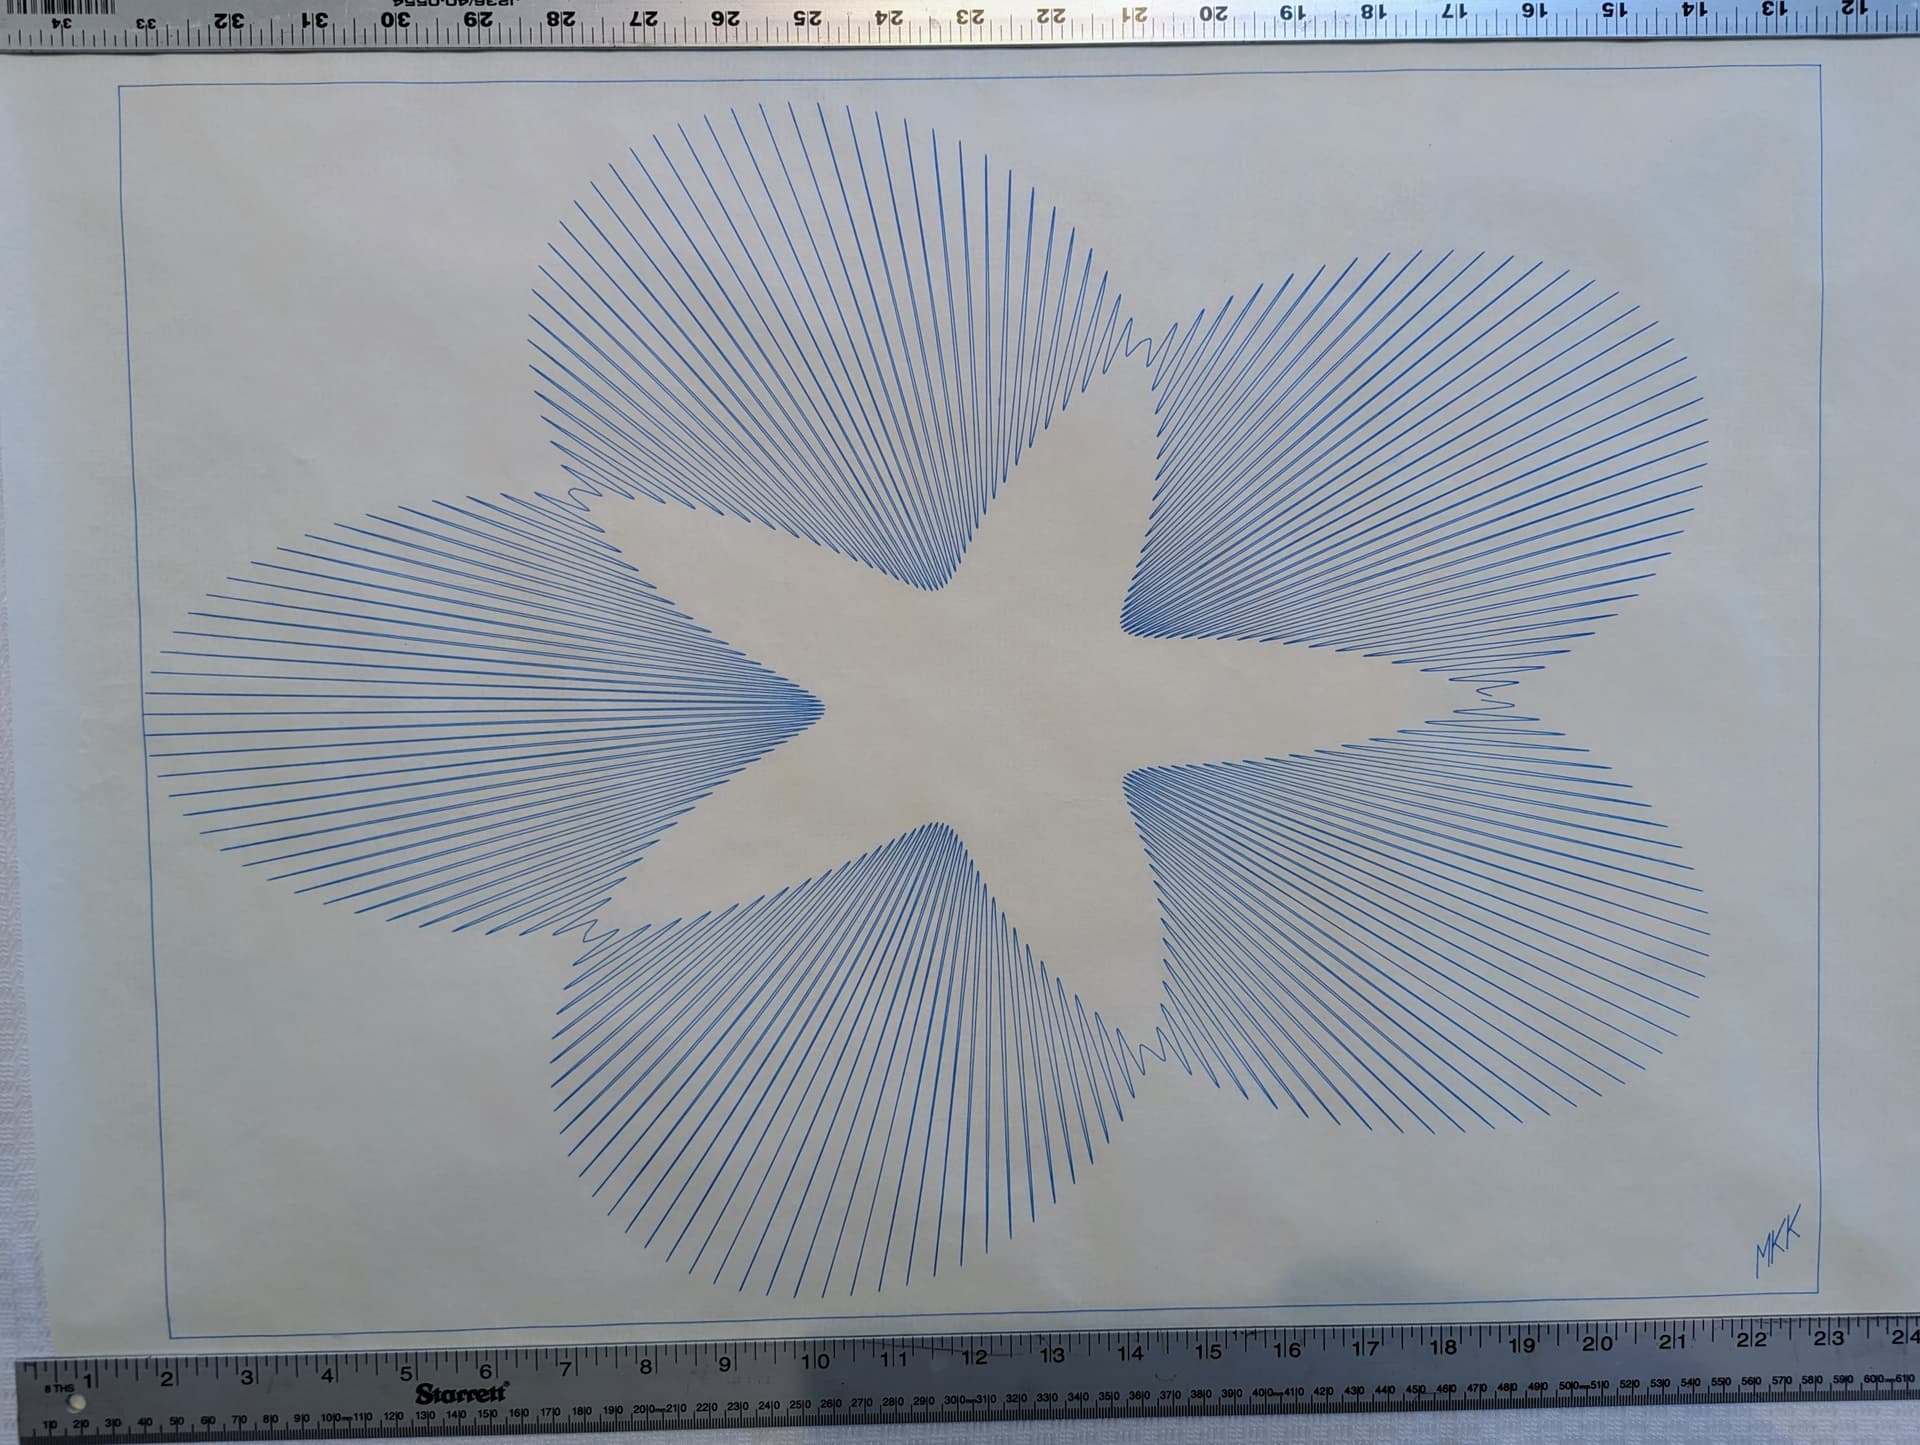
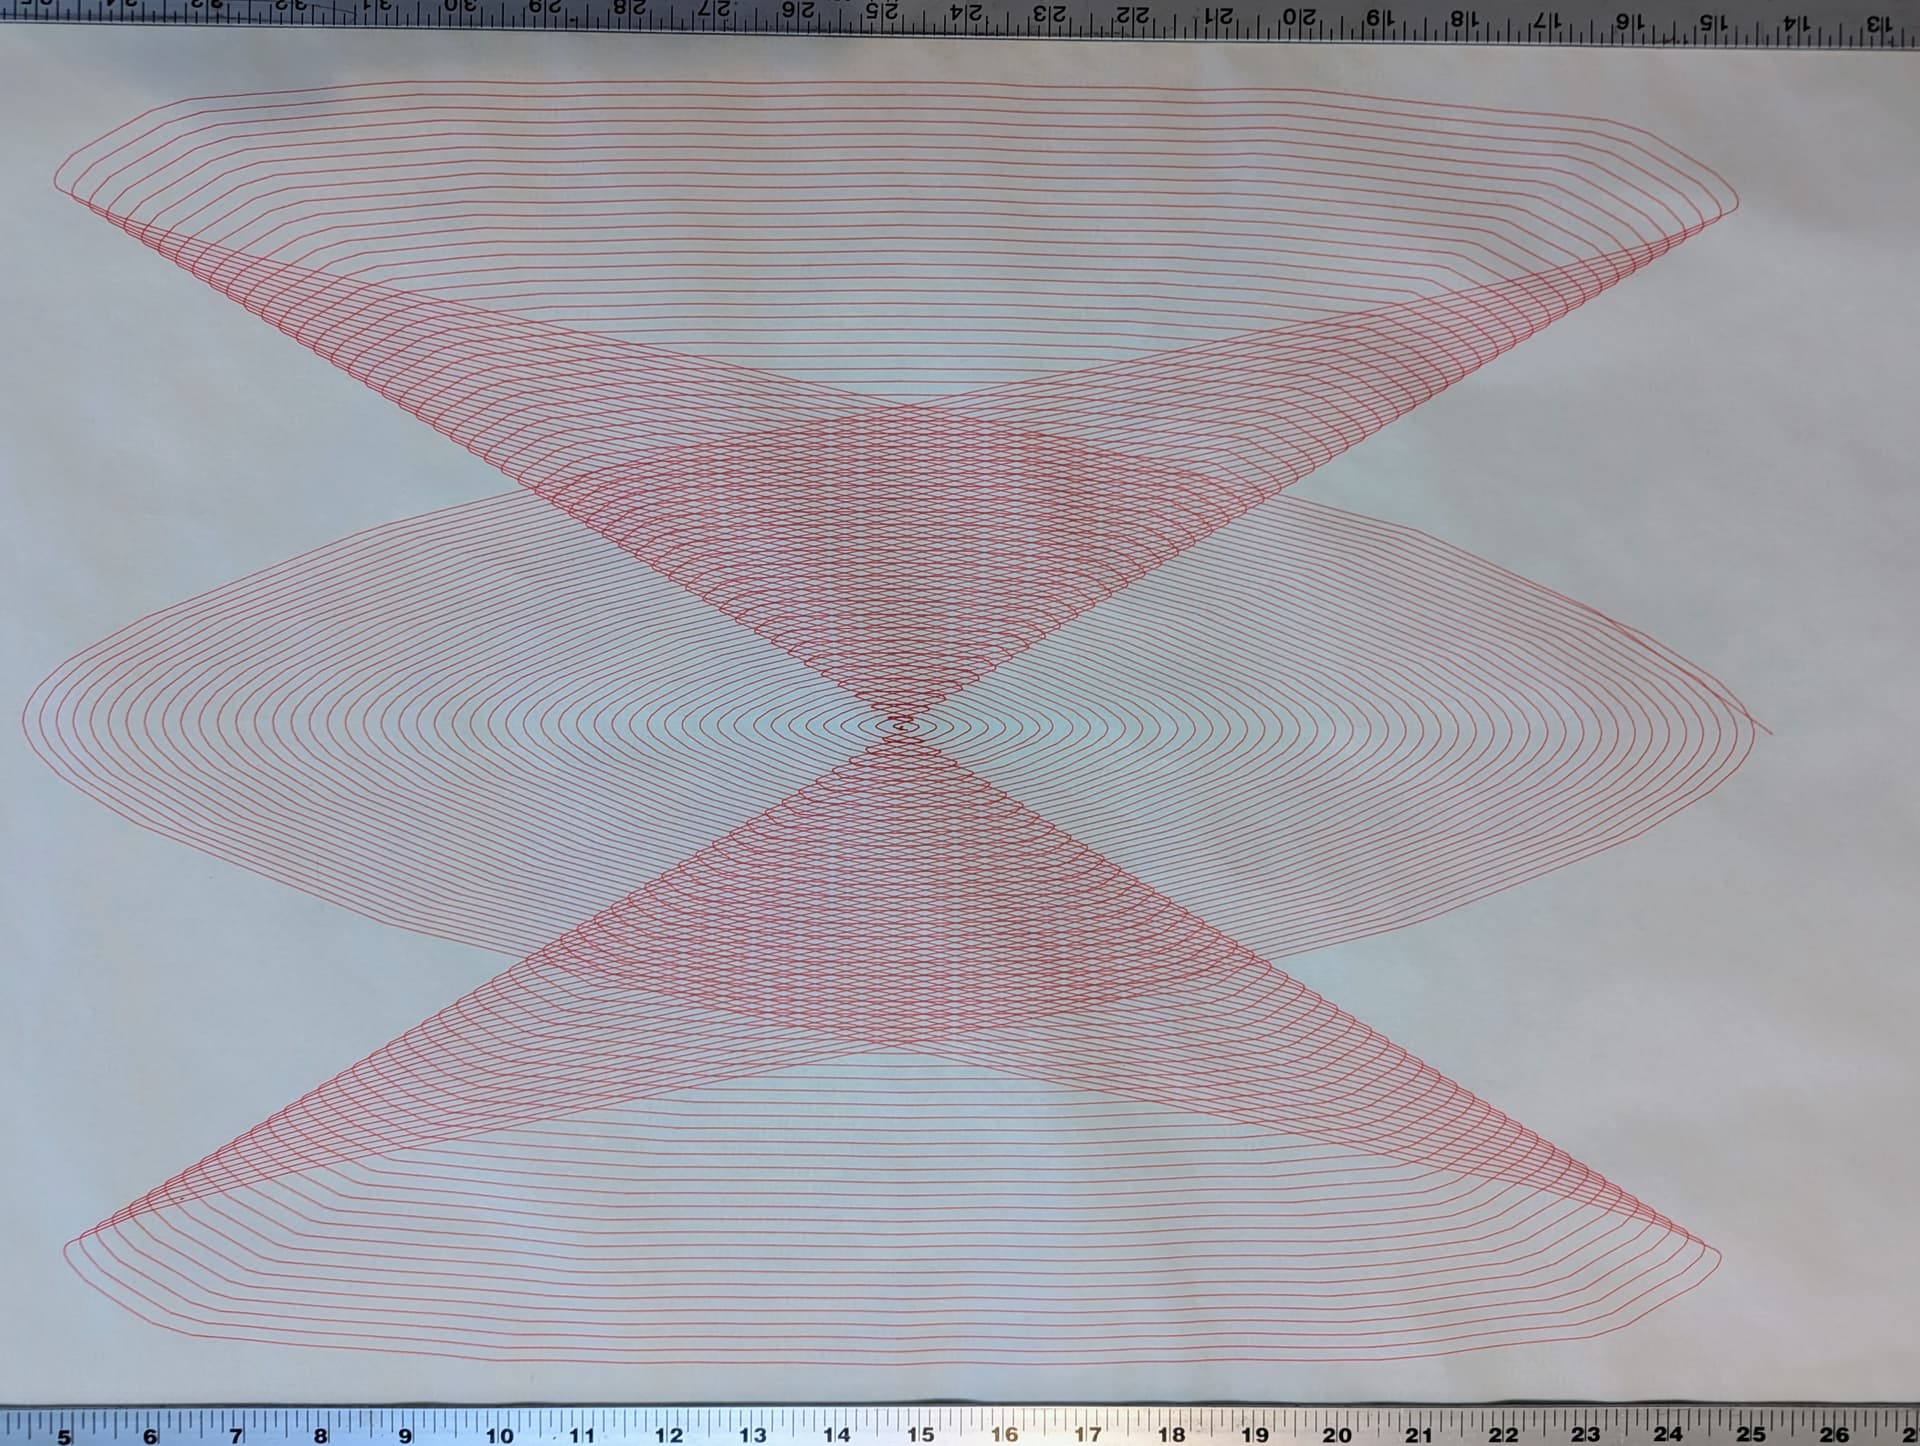
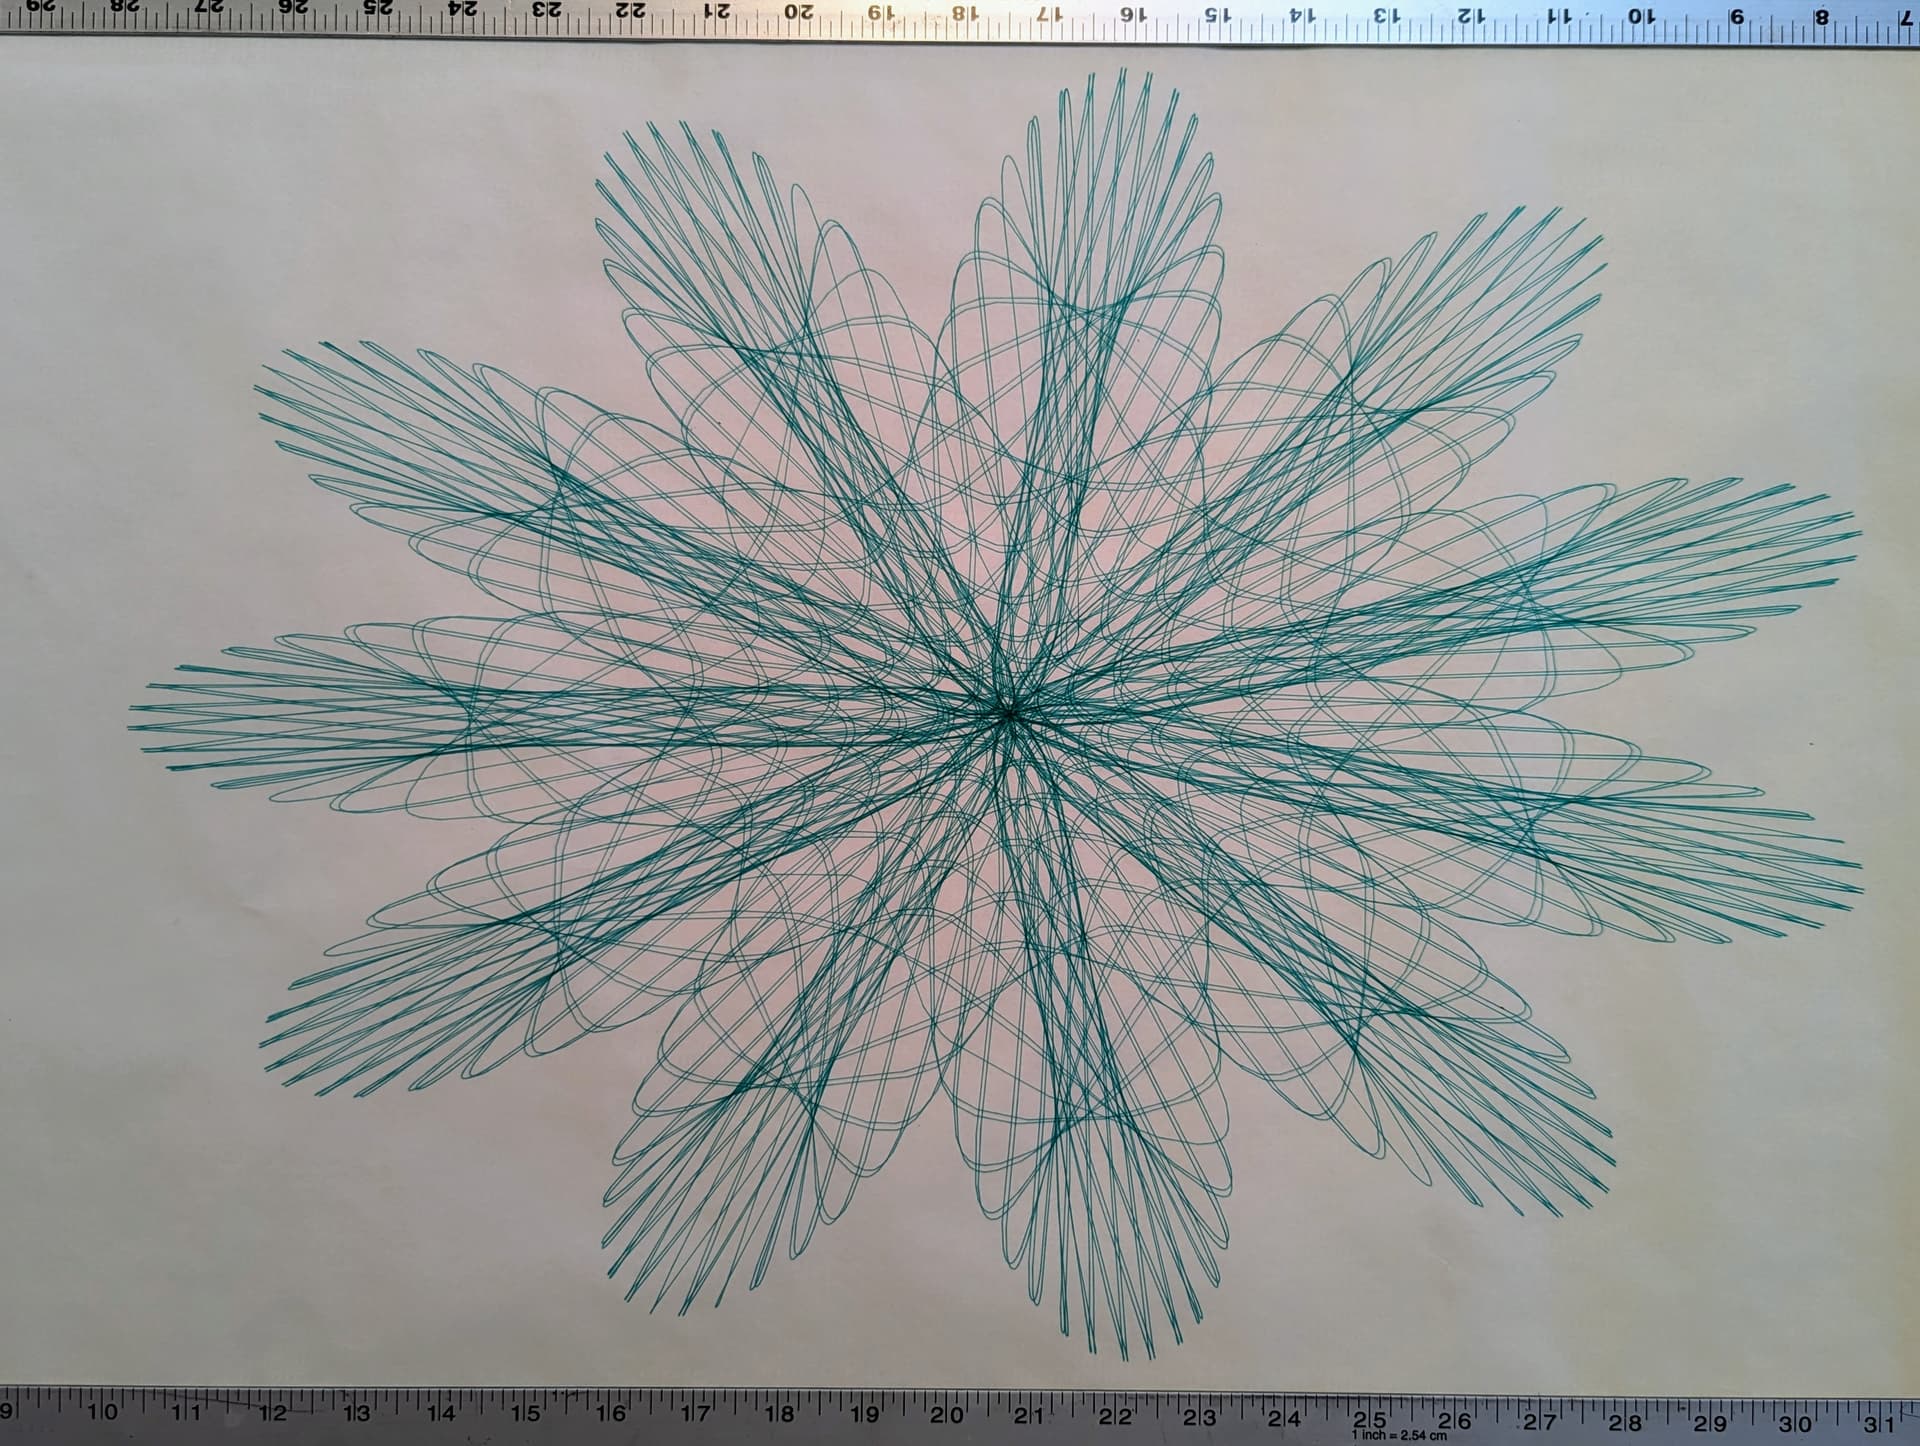
Thhis one may be related to a mistake I remember making. I had inadvertently plotted in polar coordinates when initially set out to plot in cartesian coordinates. Funny the things you remember.
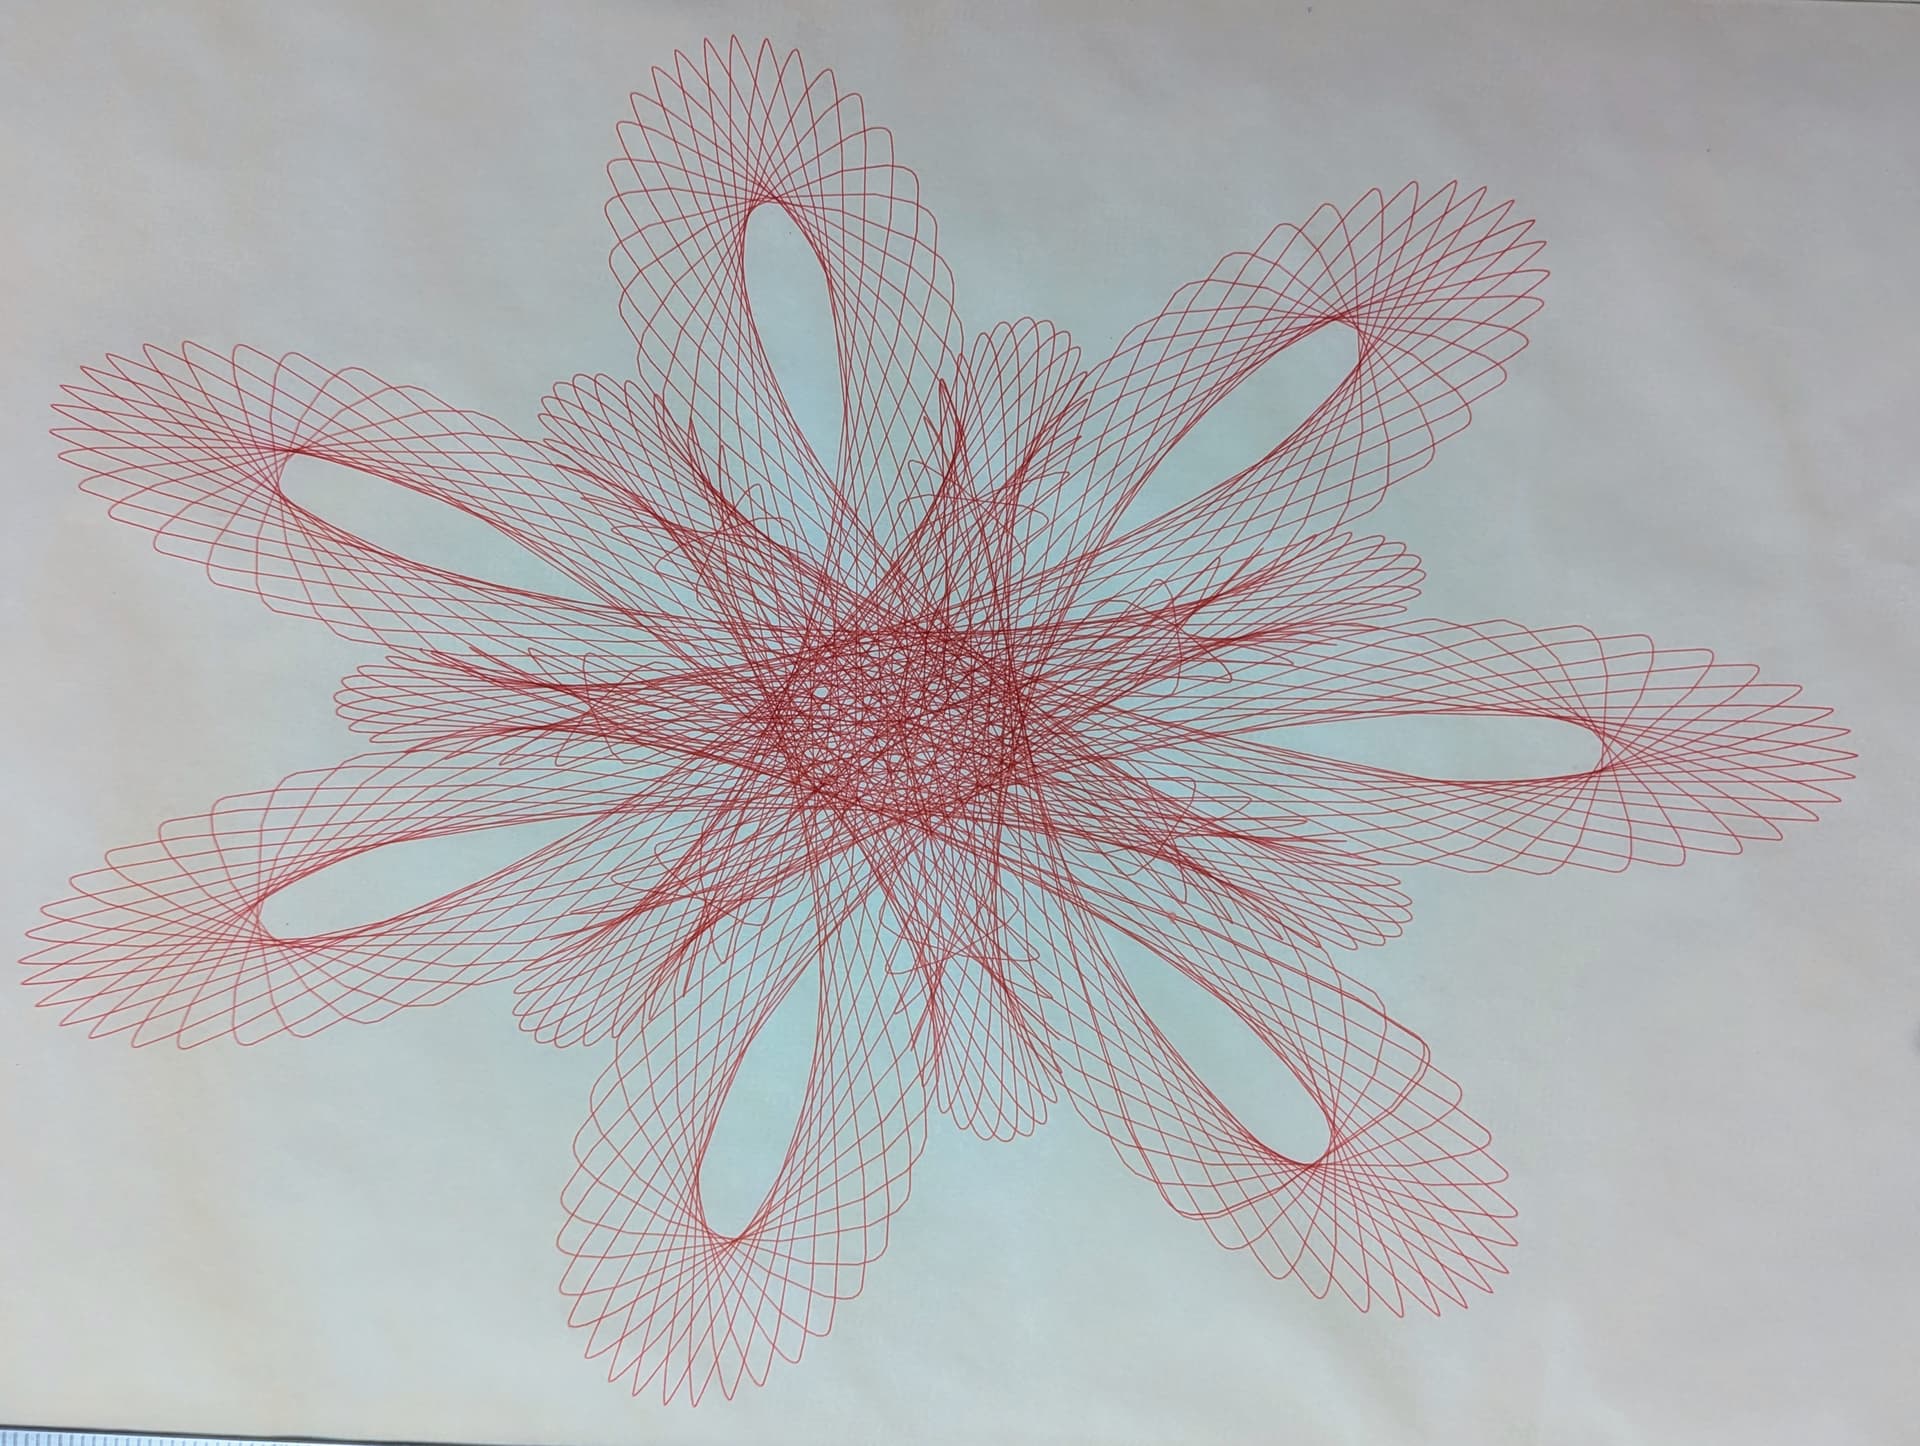
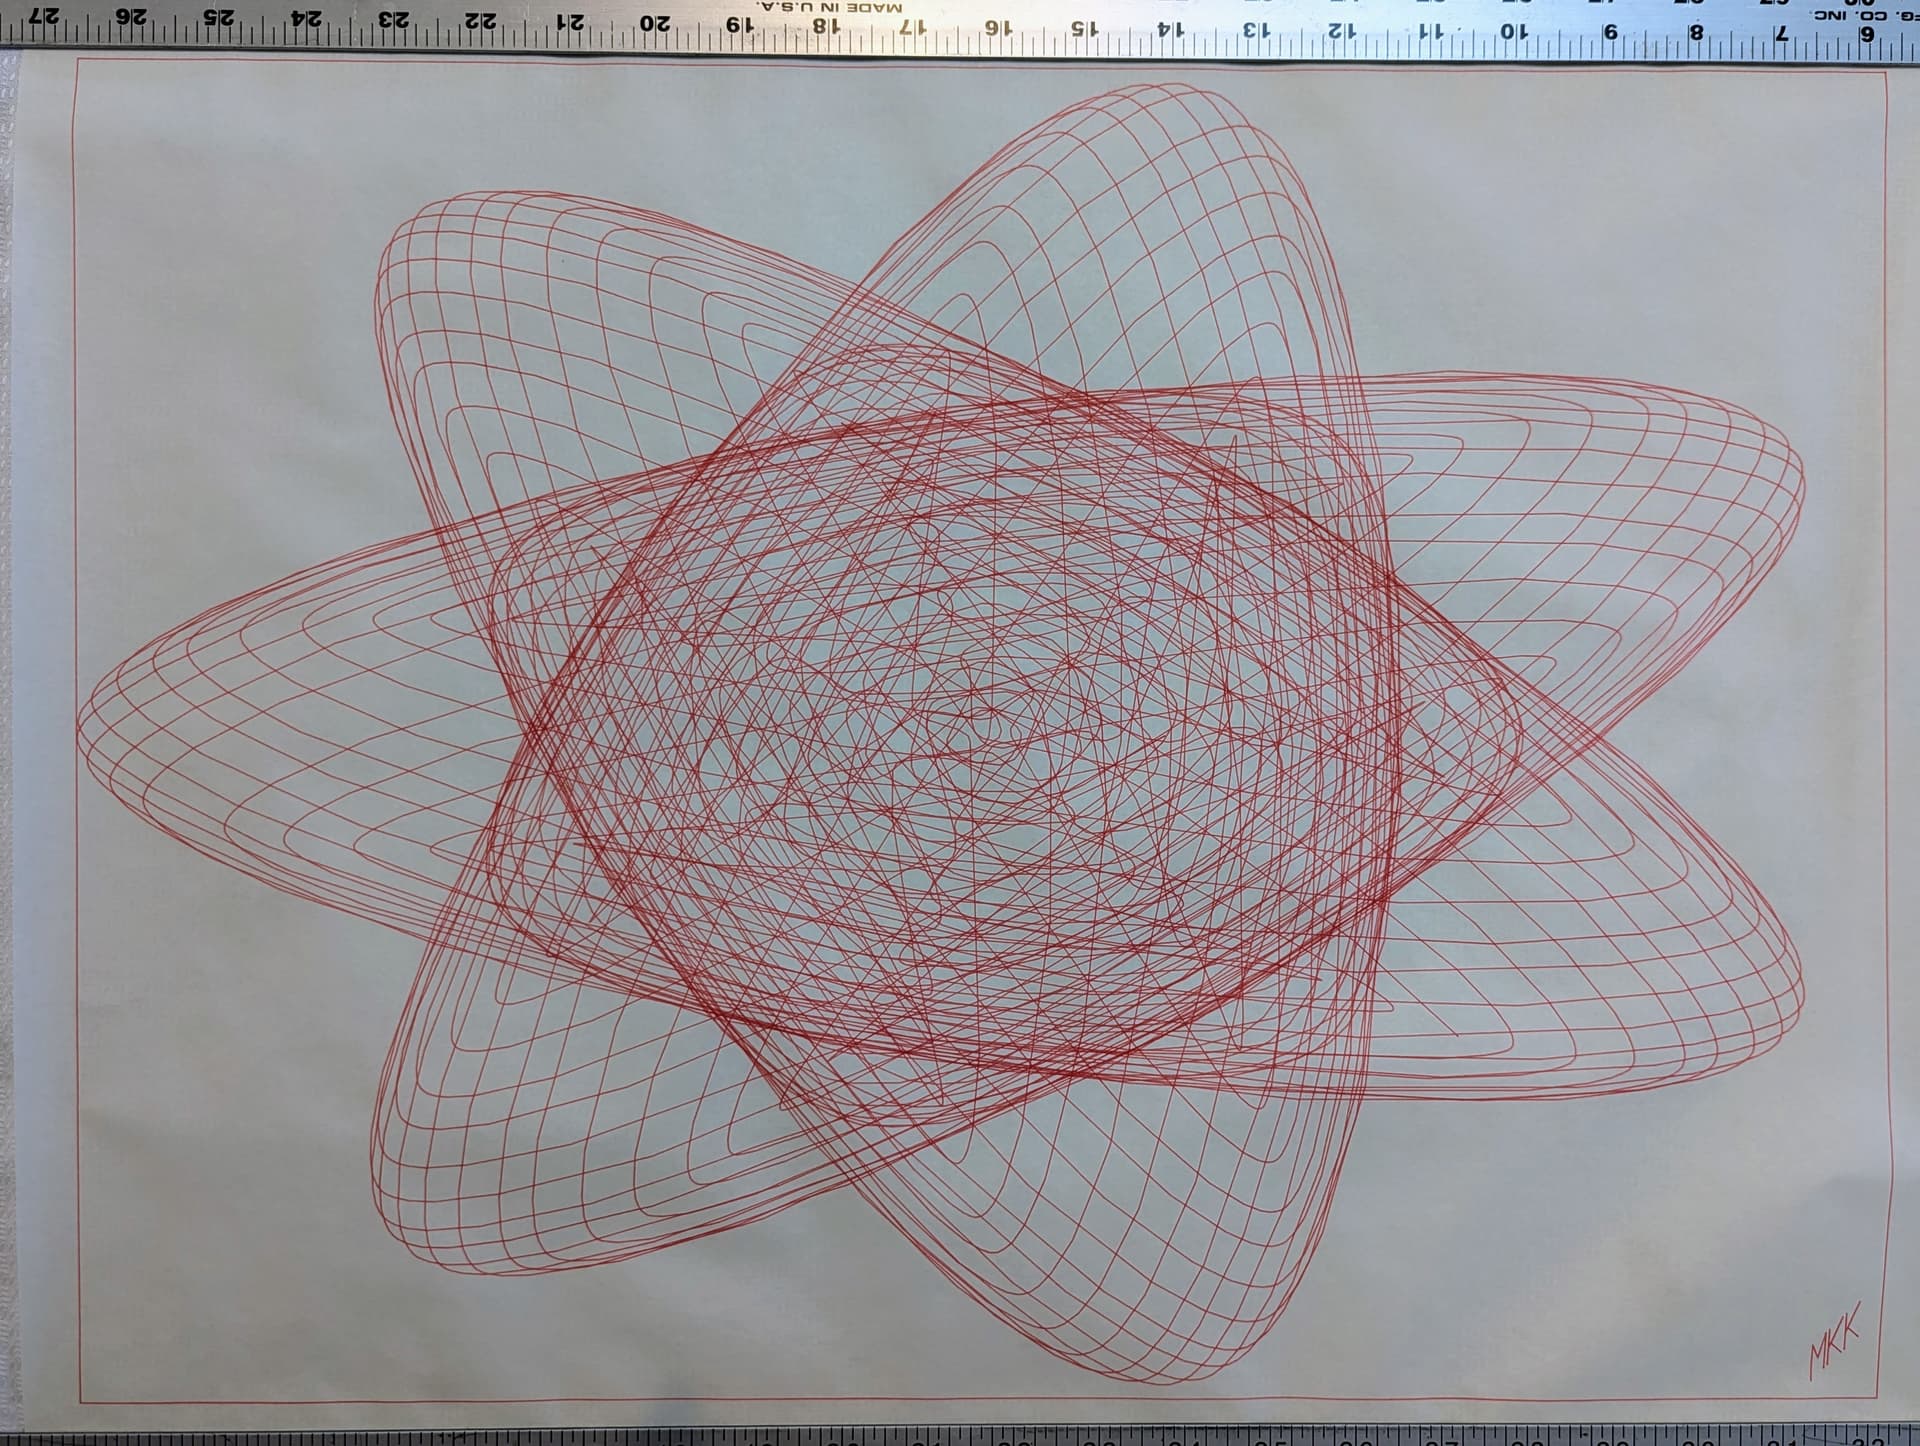
This looks like a layered Zow. The zow progam creates symmetrical graphics that grow from the center to the edges of hte plot.
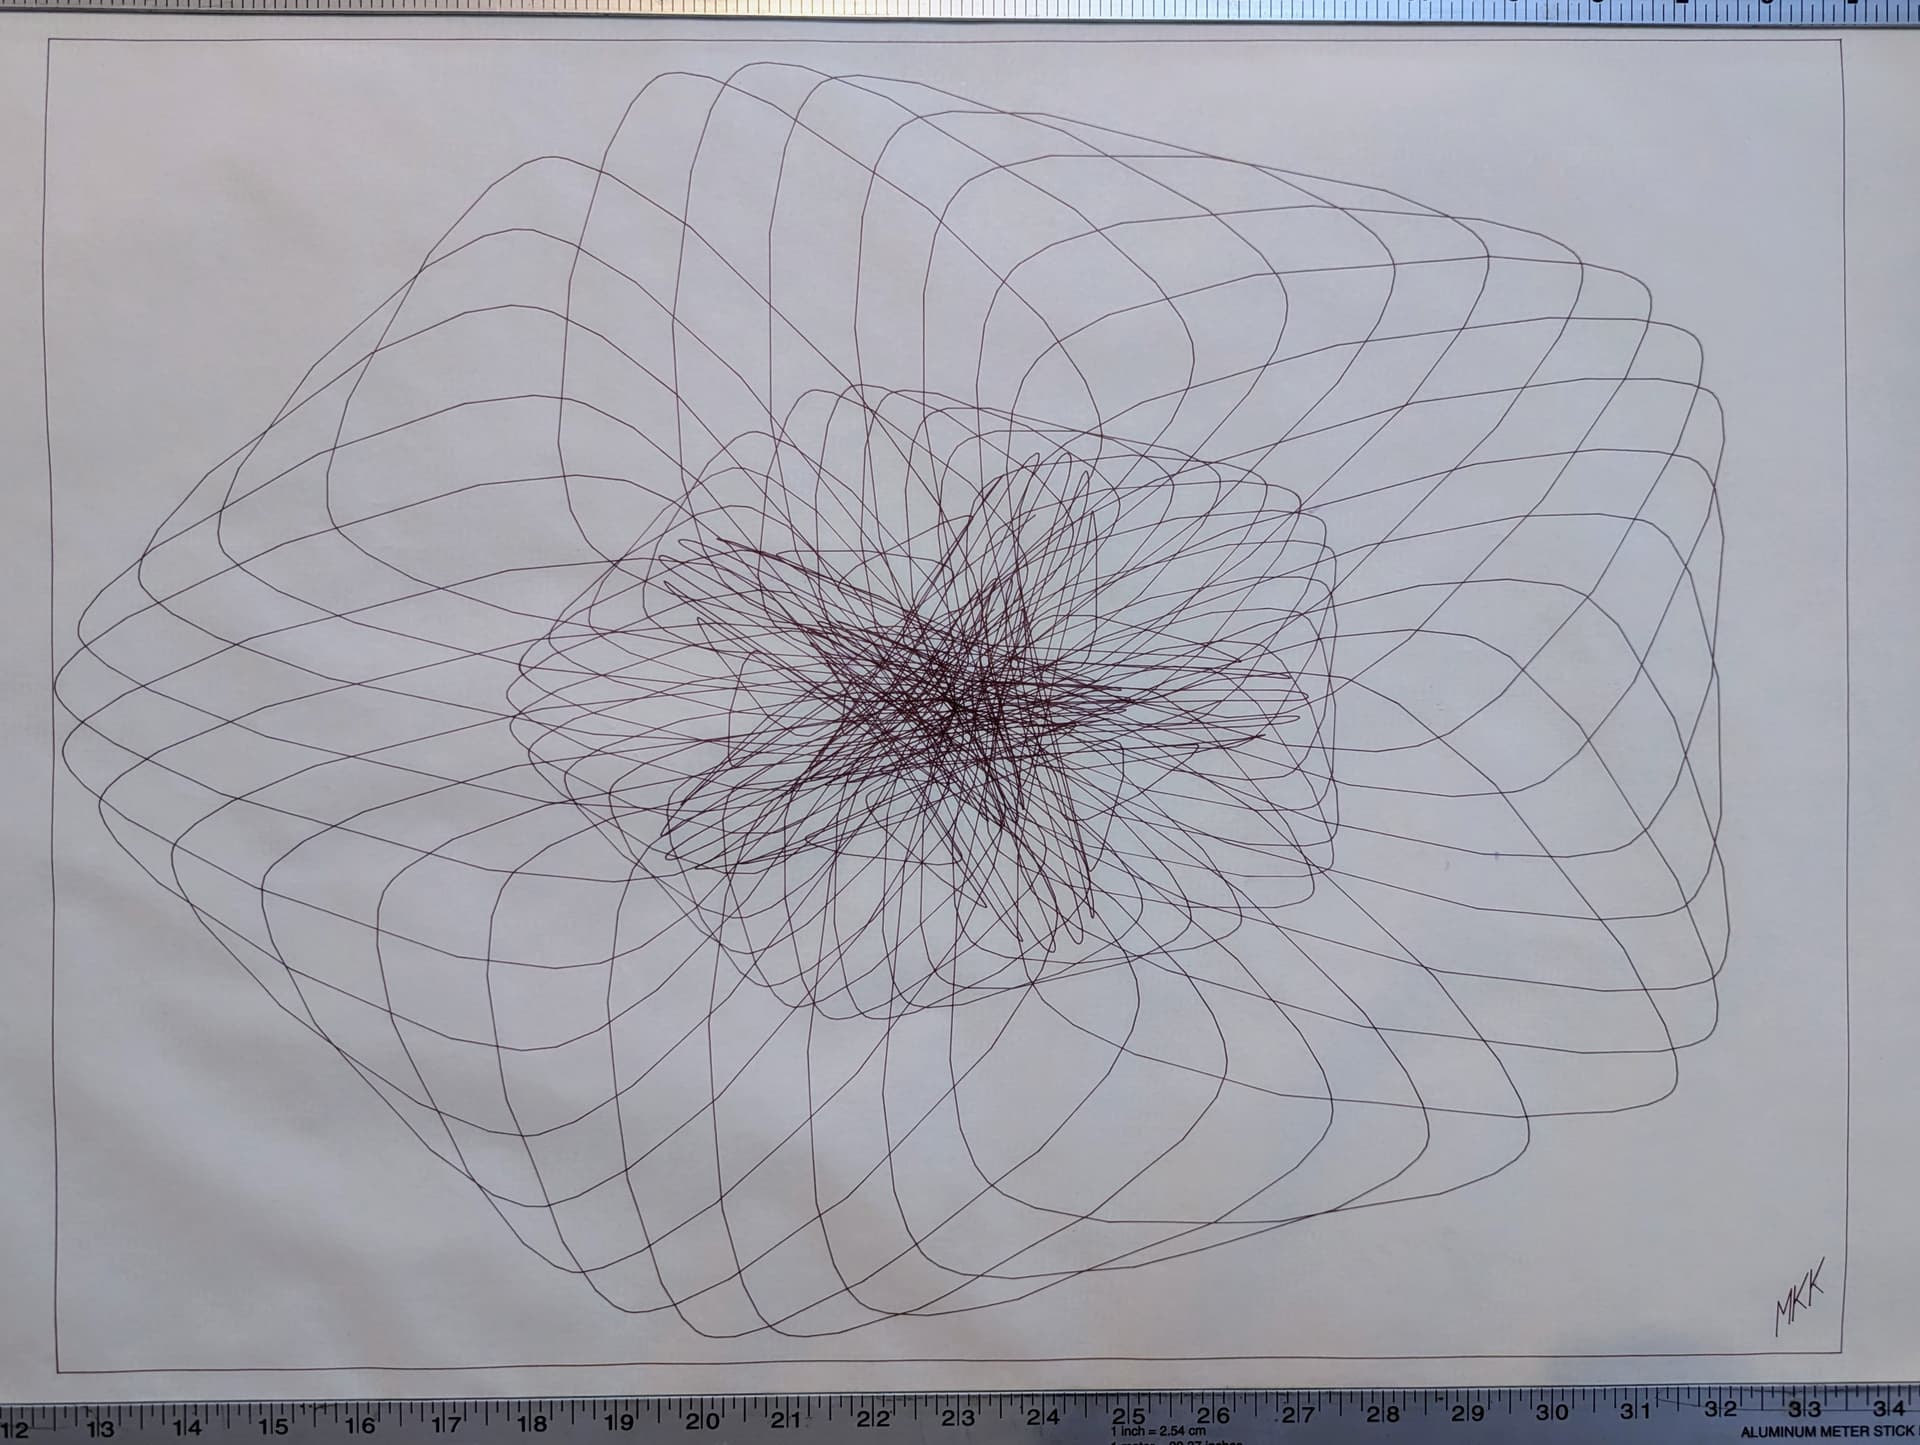
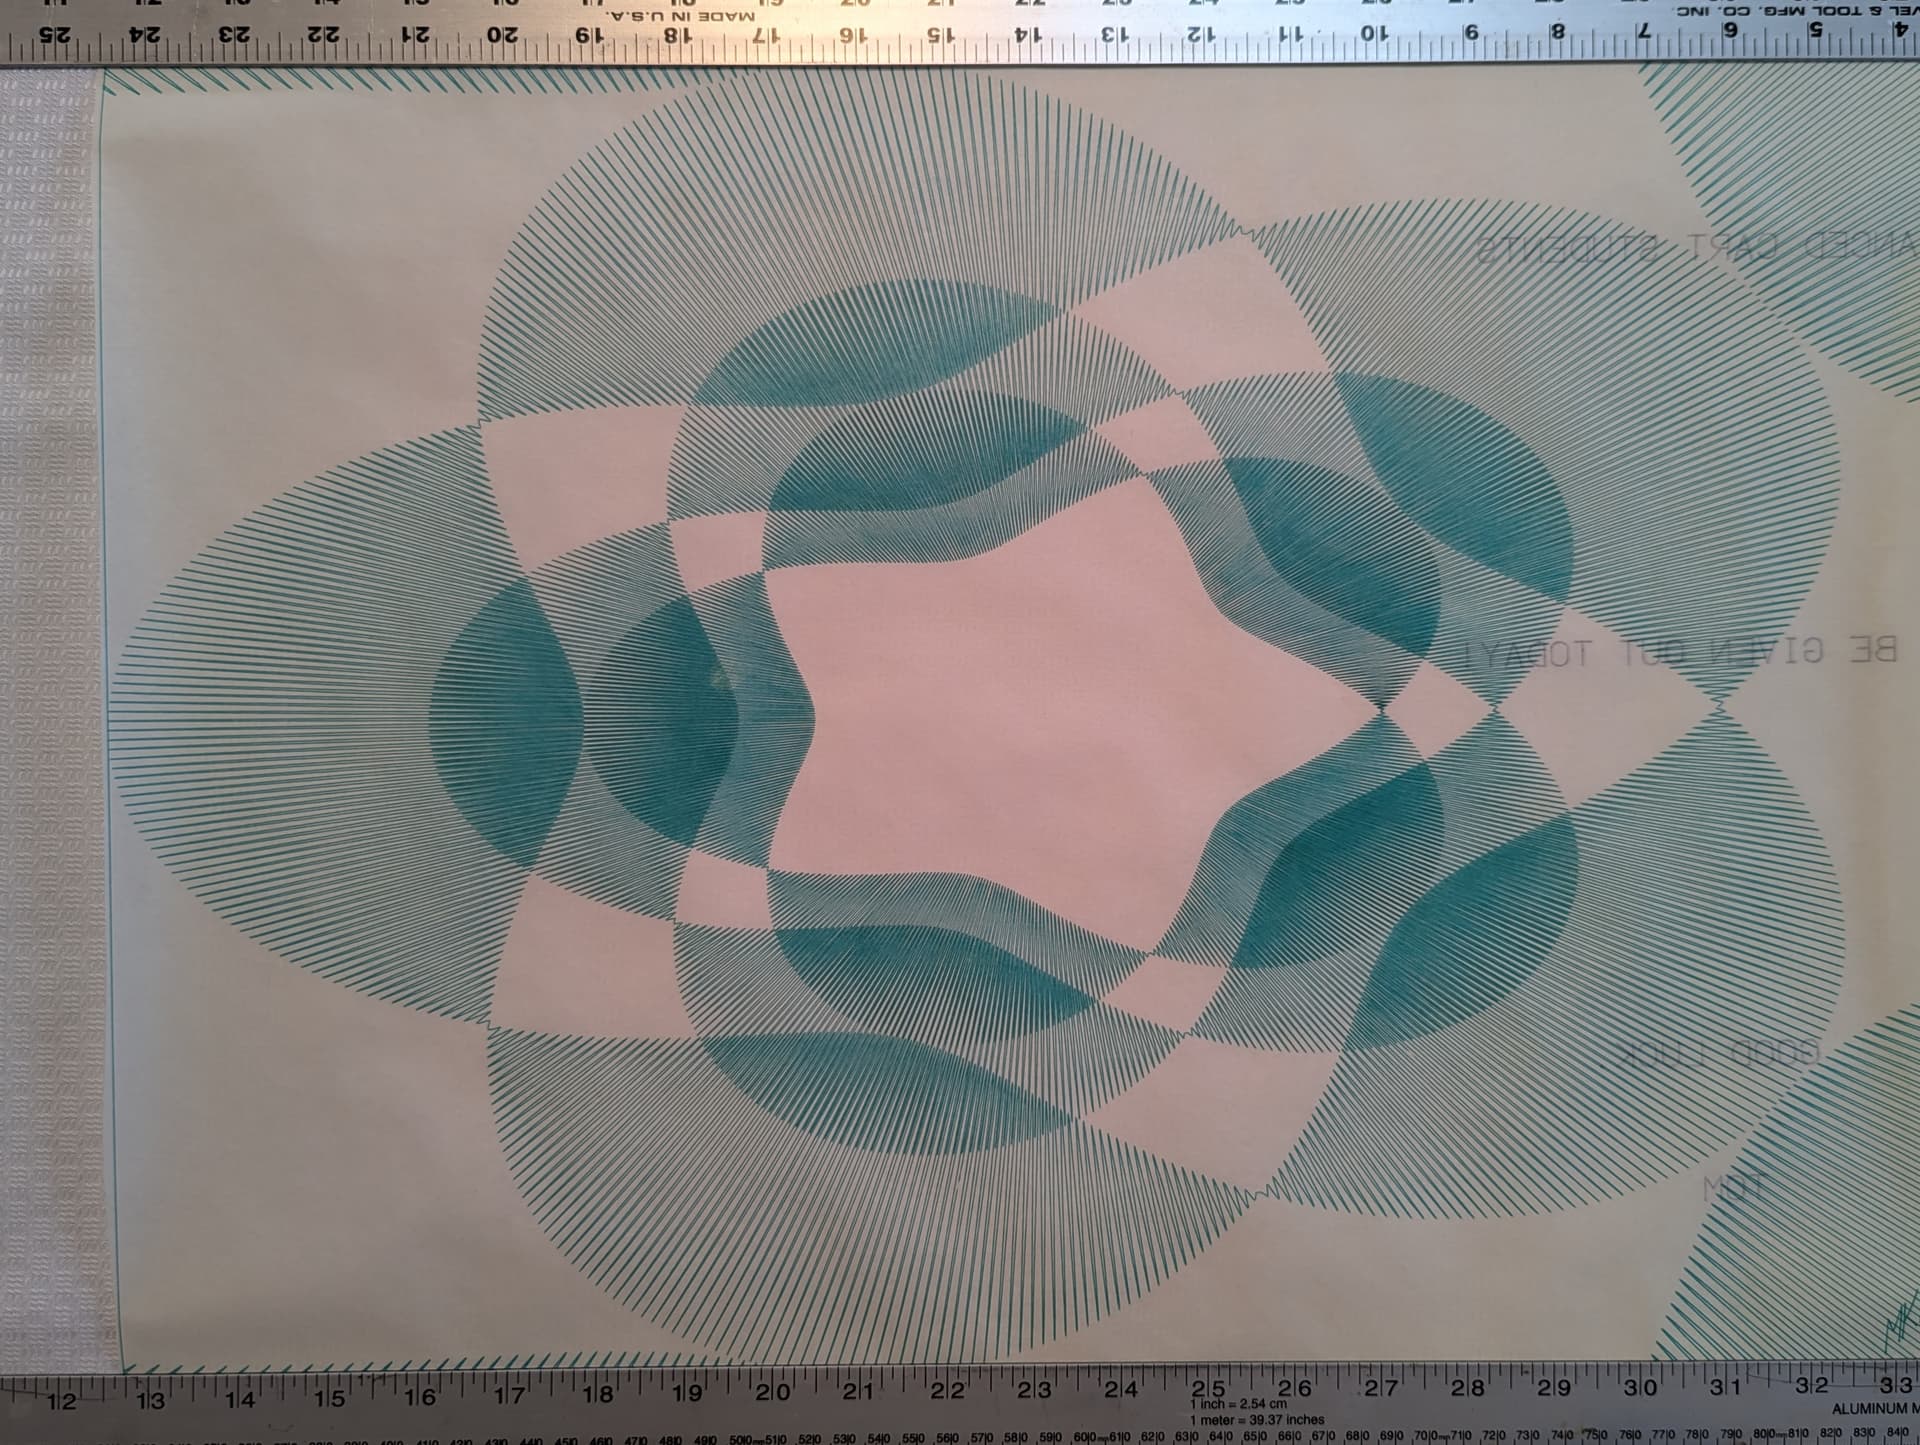
To this day I am impressed wtih the 3D effects you can get, while not having to do any 3D.
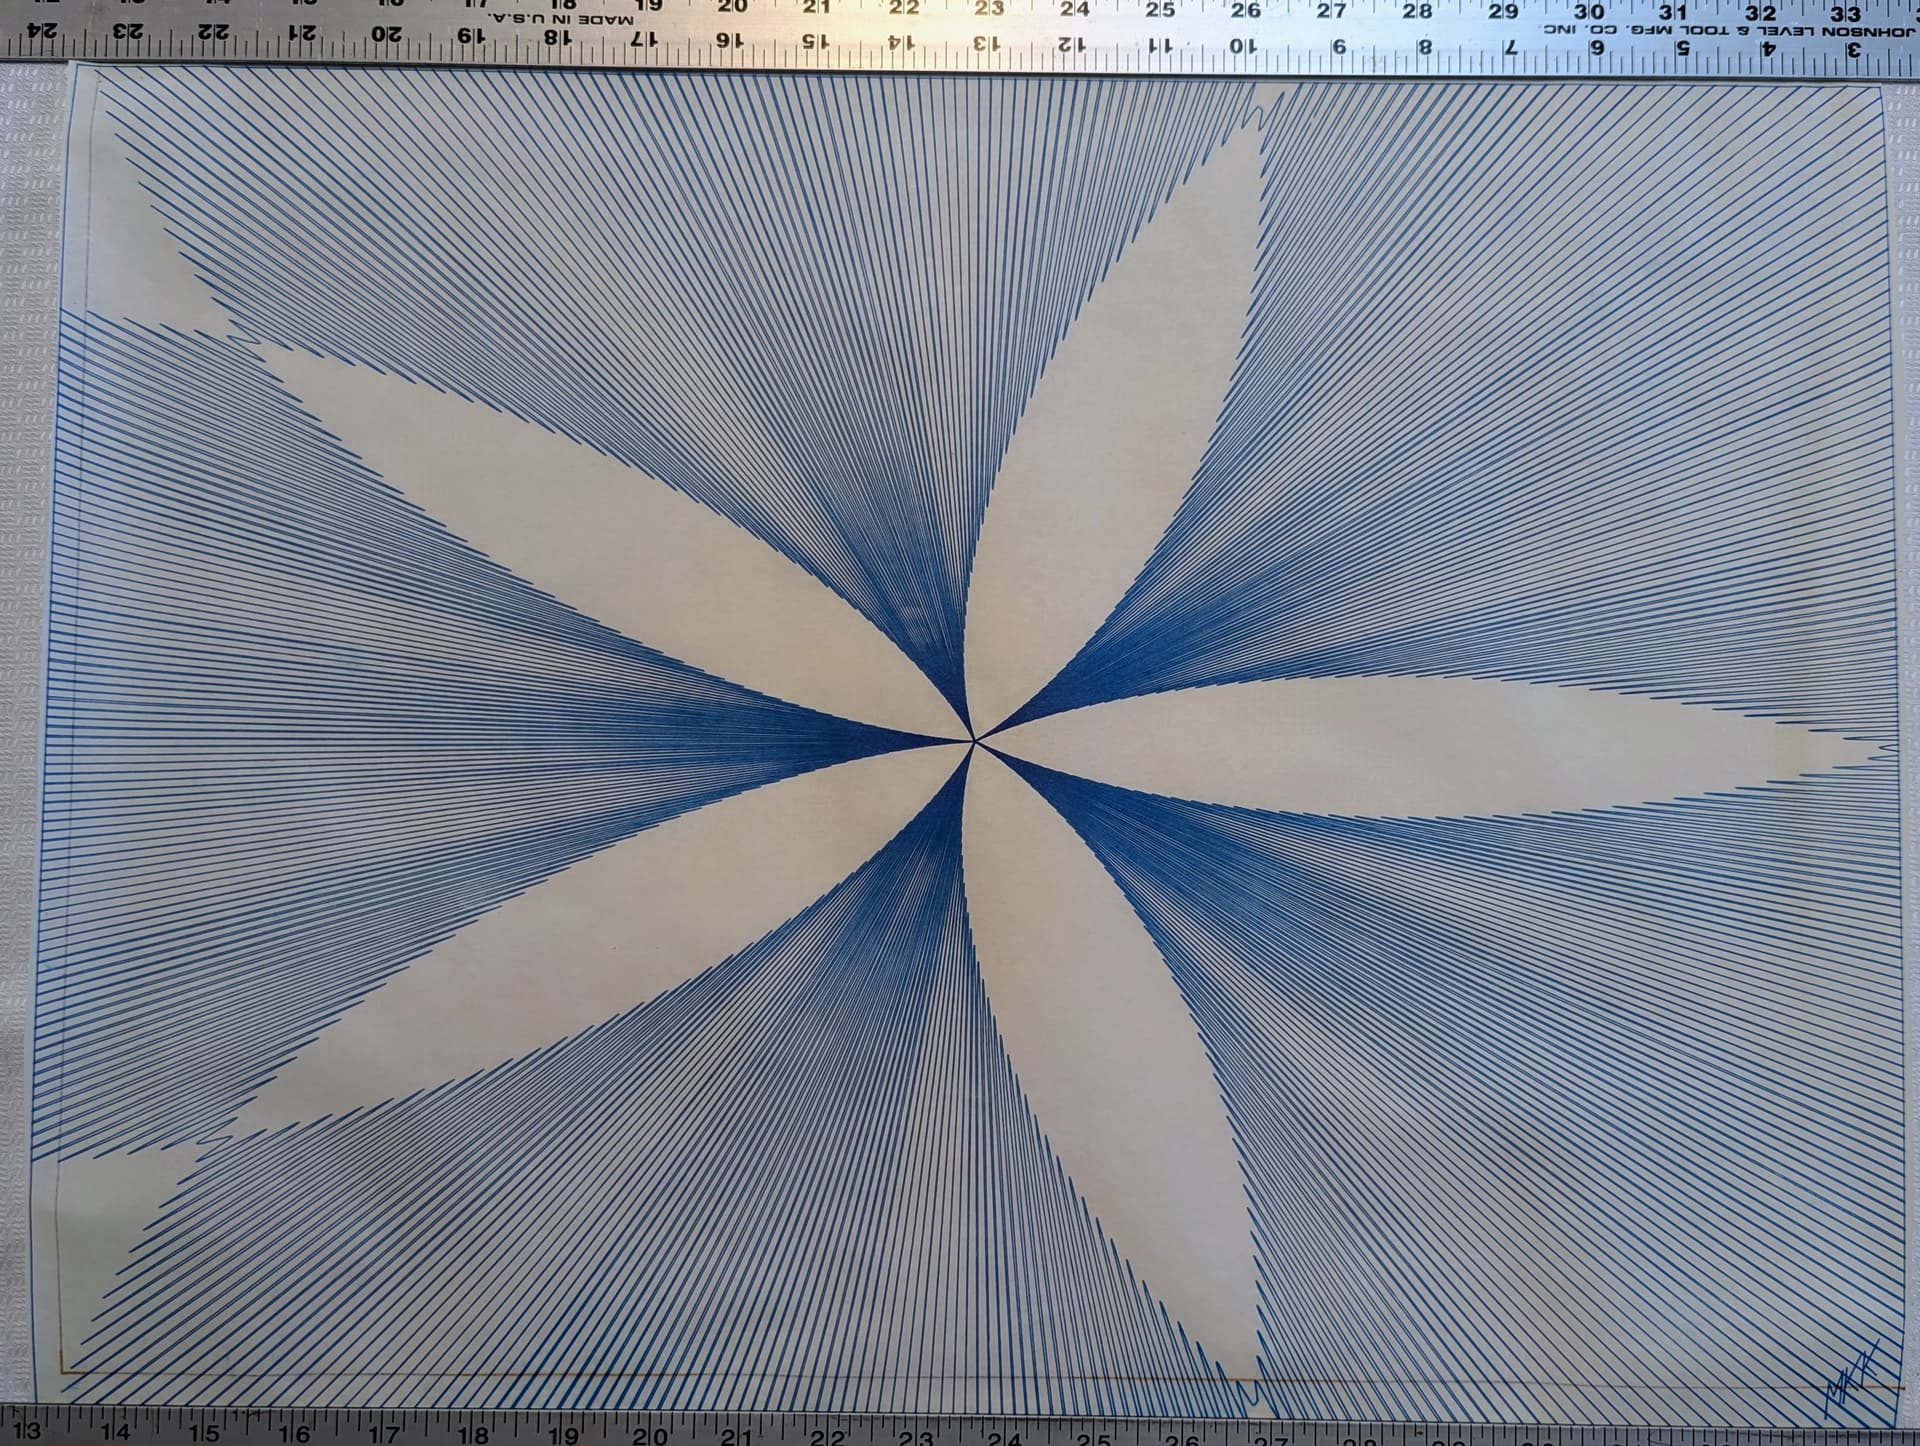
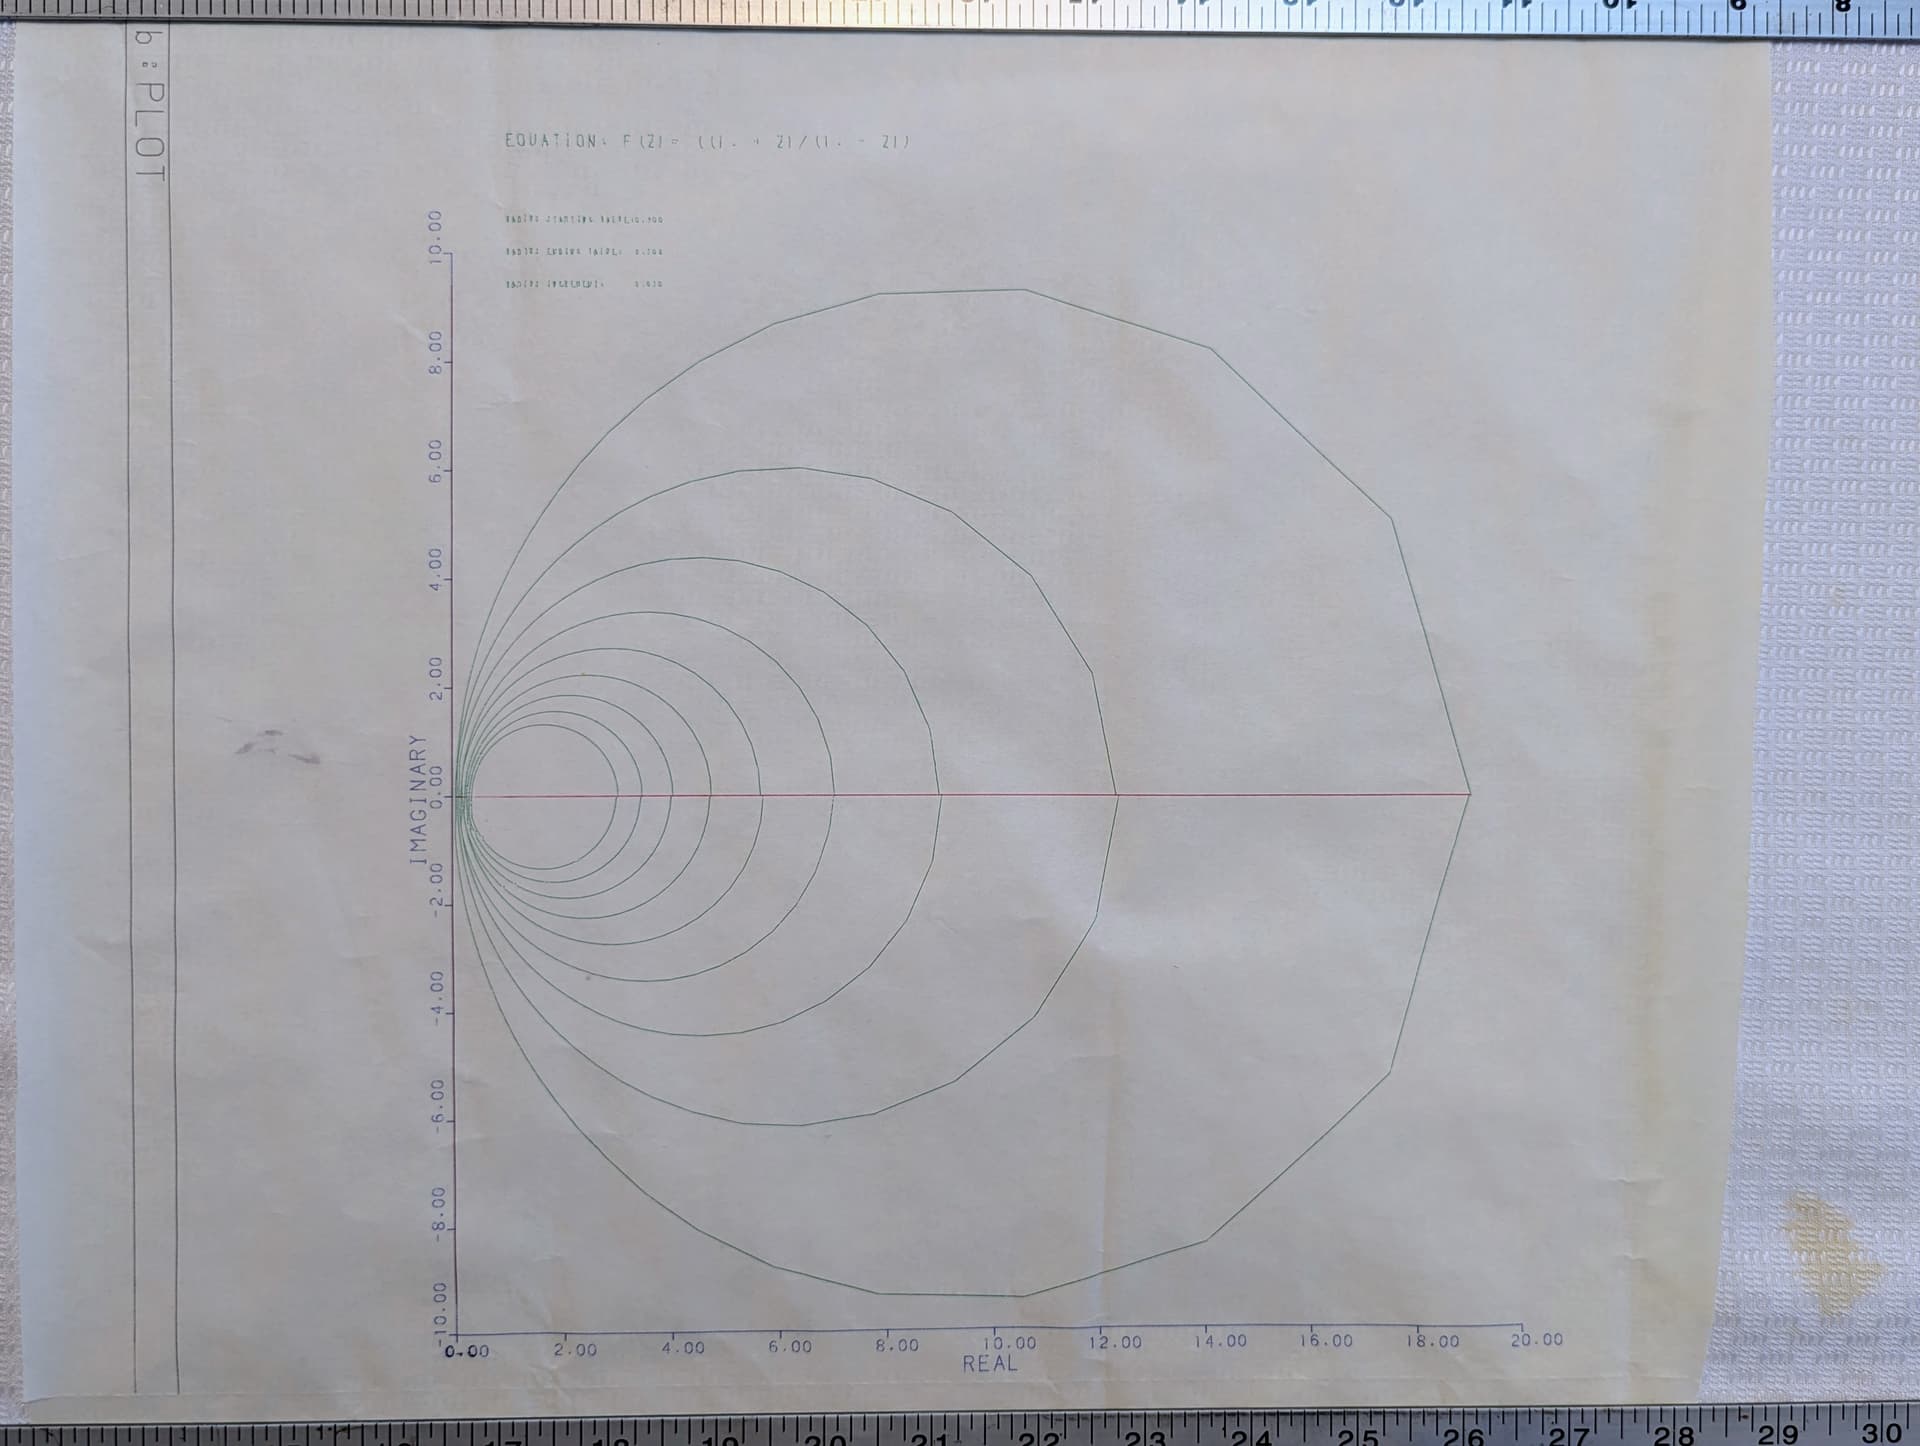
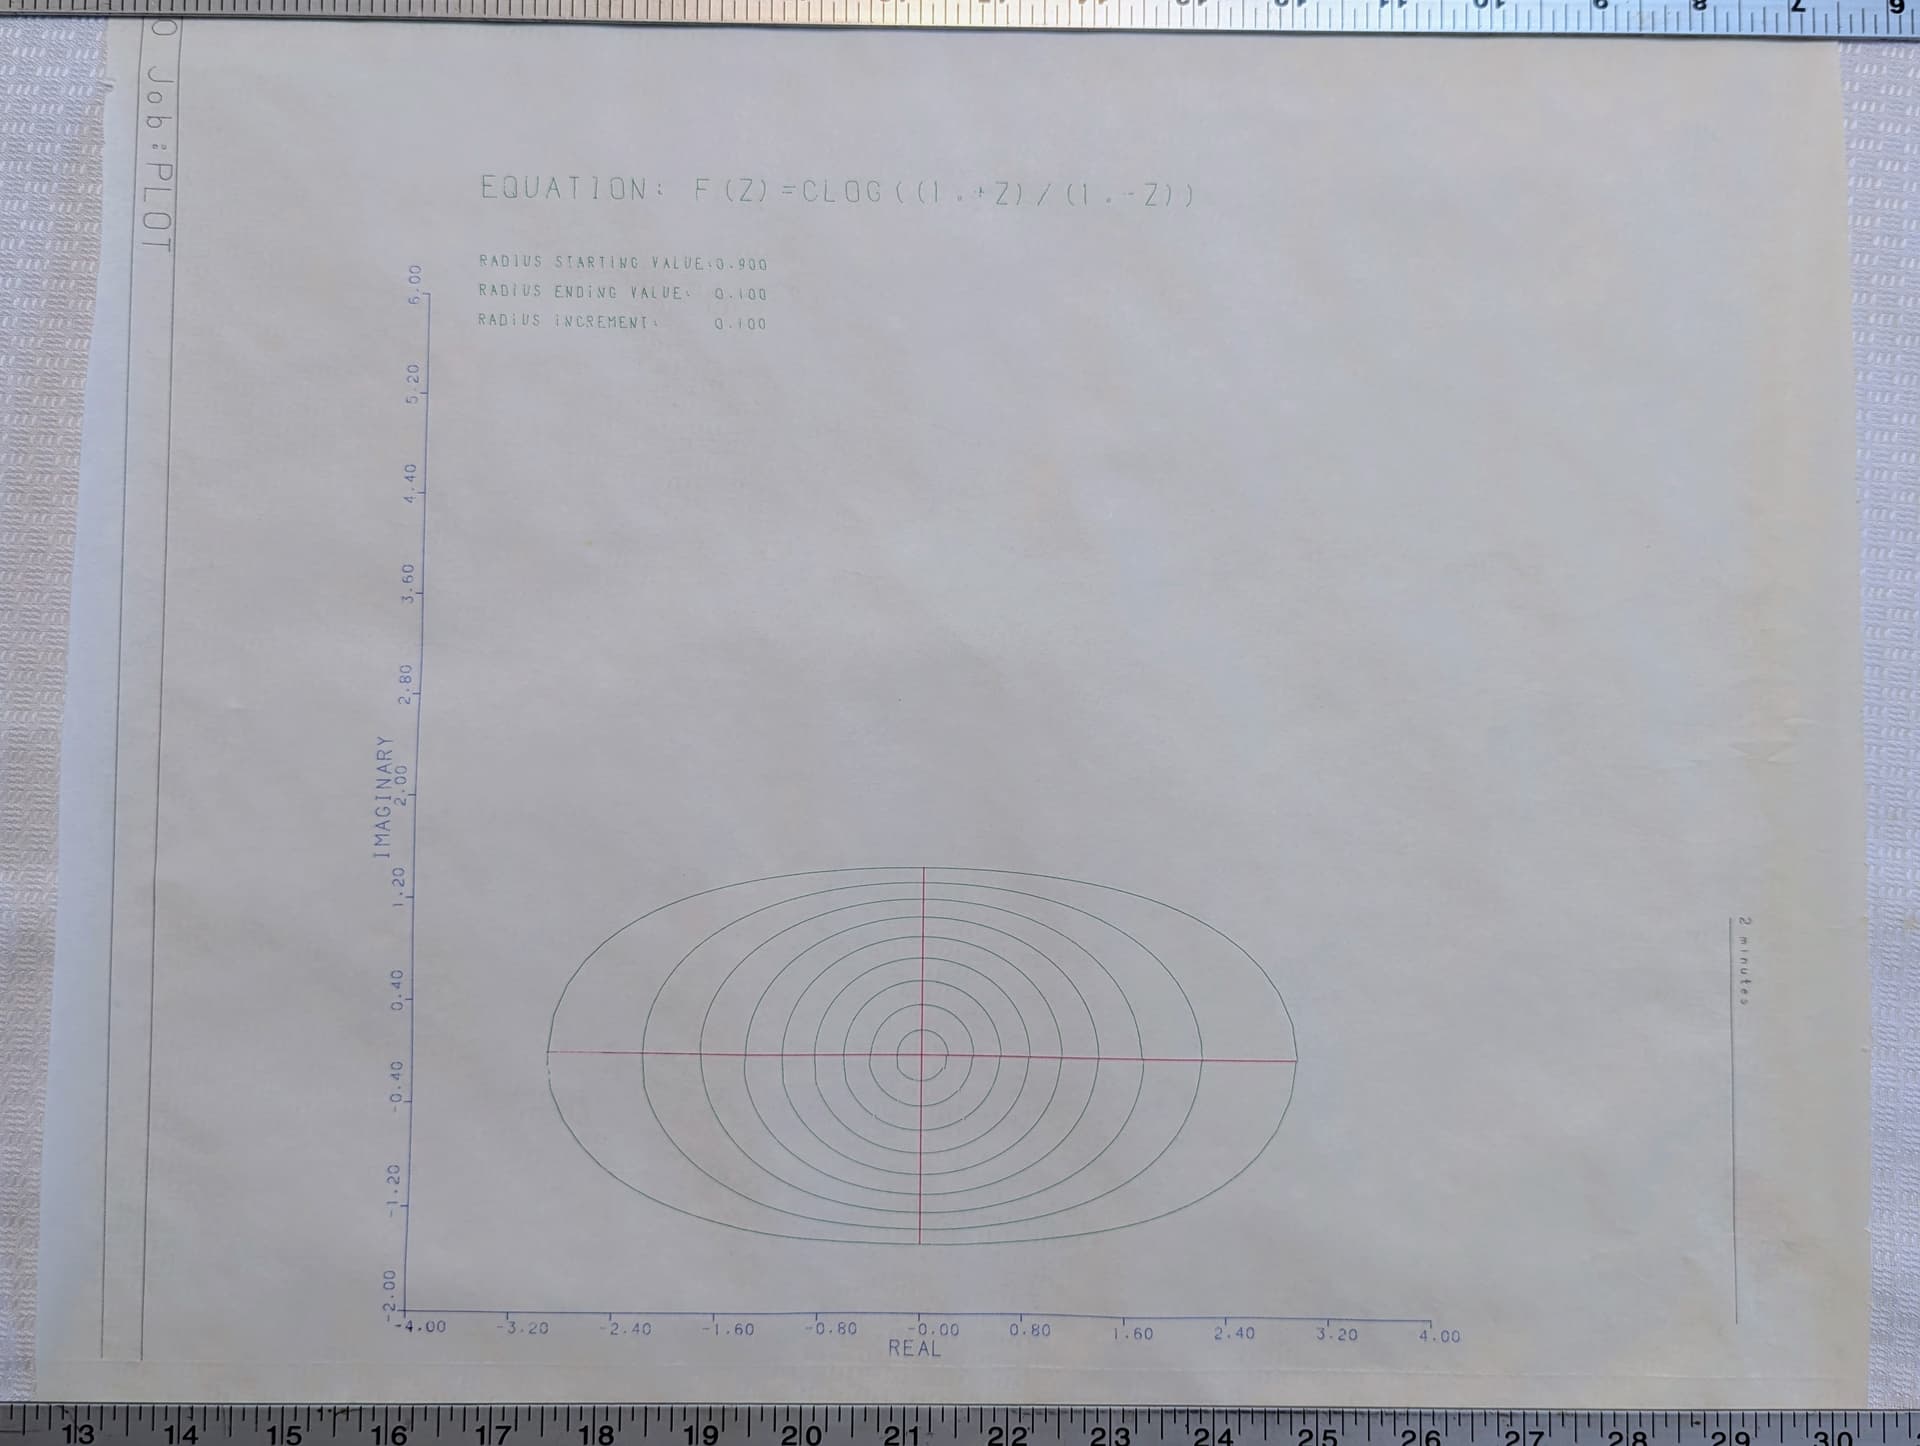
I had a project working with one of the math professors in plotting equations with imaginary numbers. My Fortran wrote another Fortran program, with an equation entered by the user.
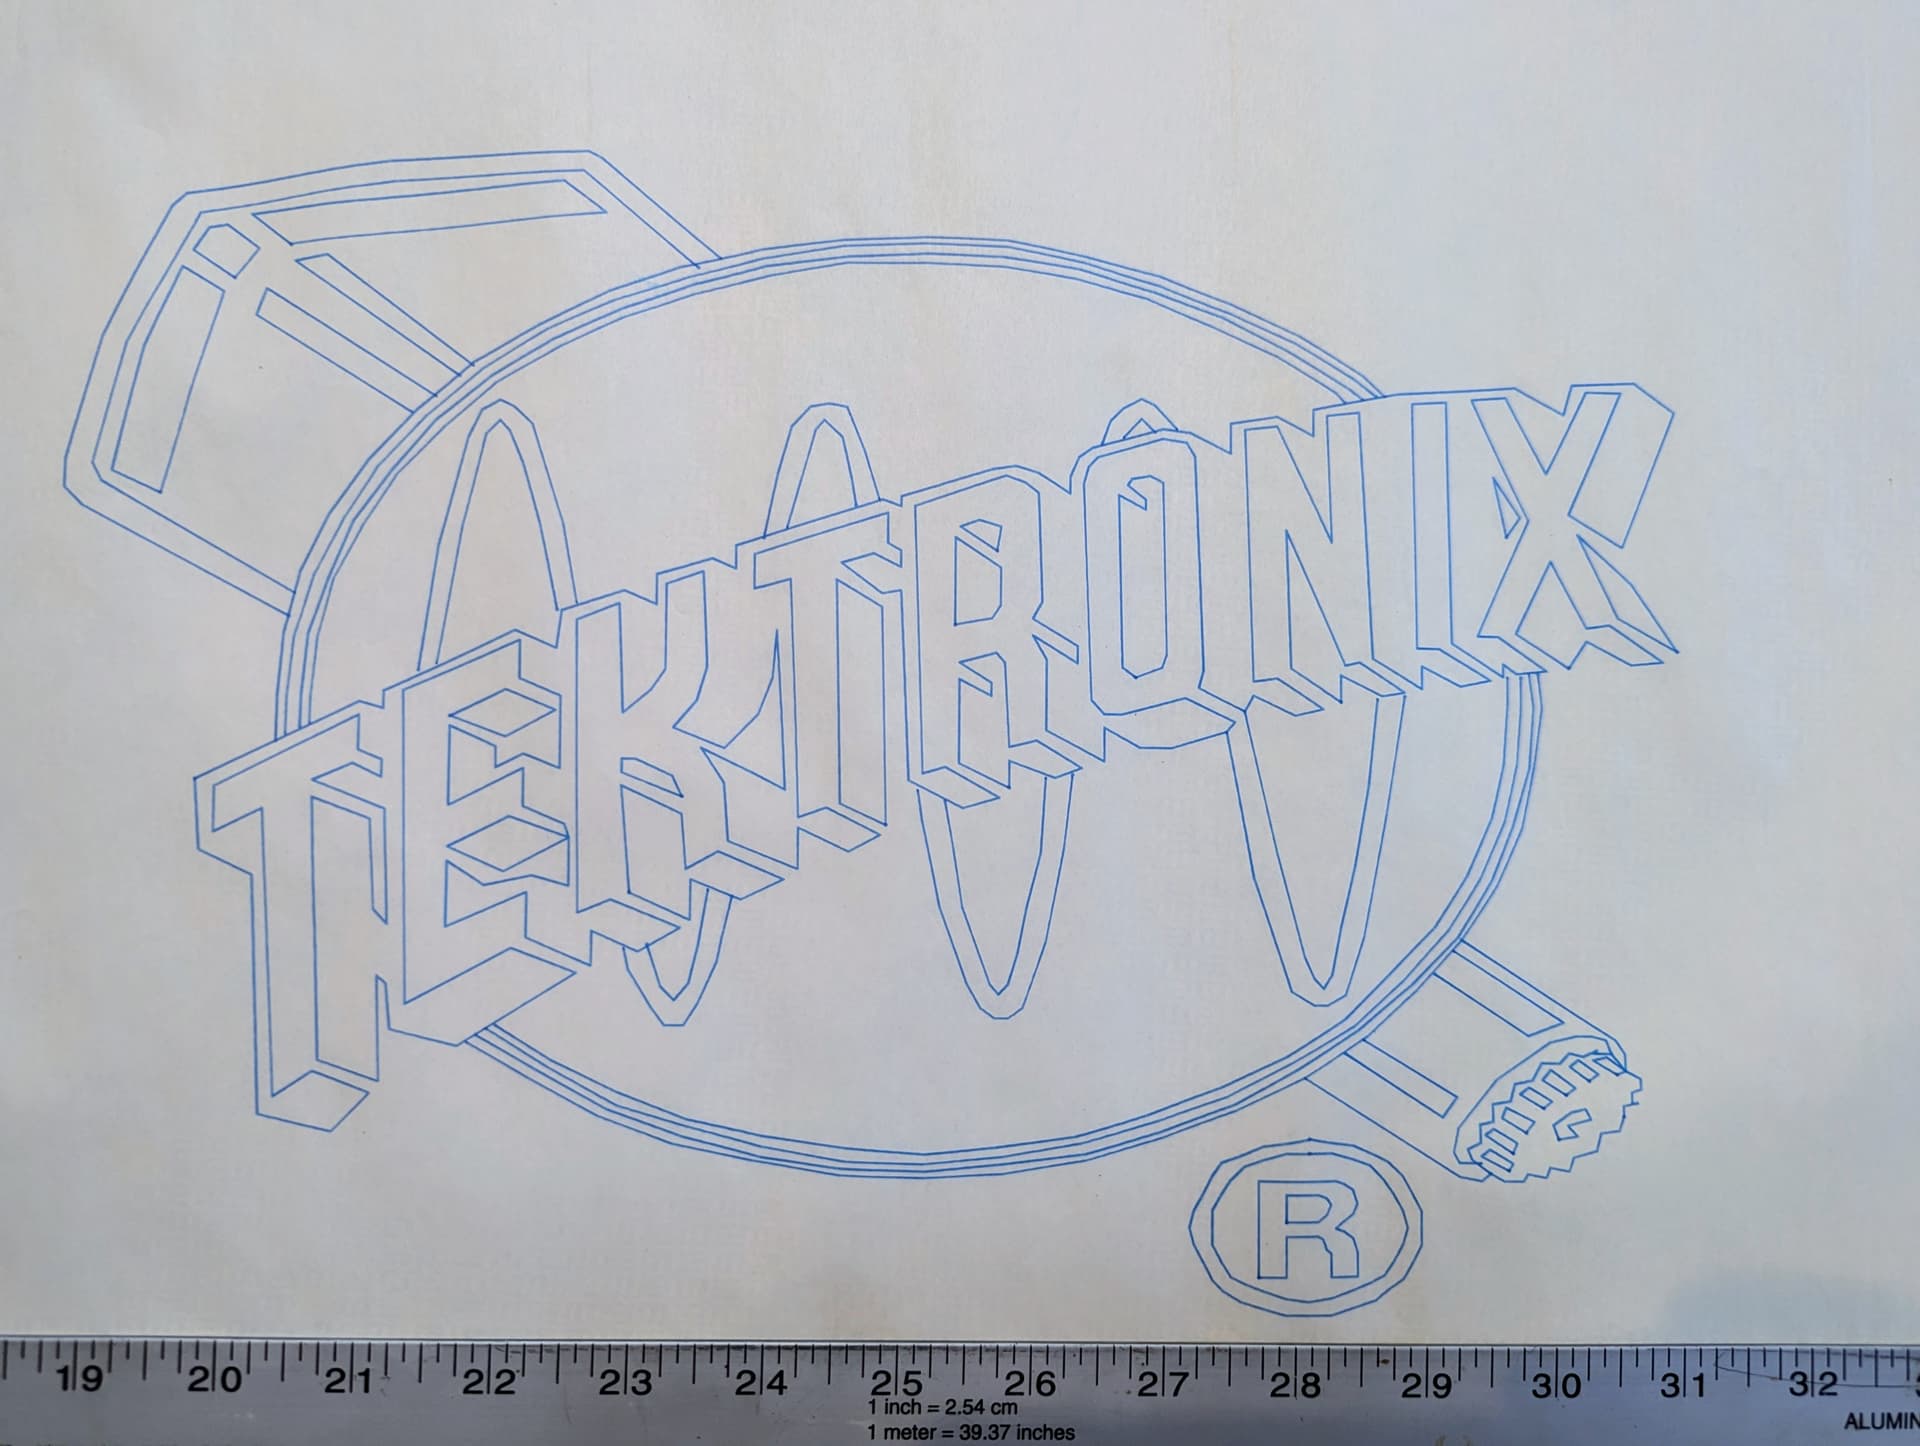
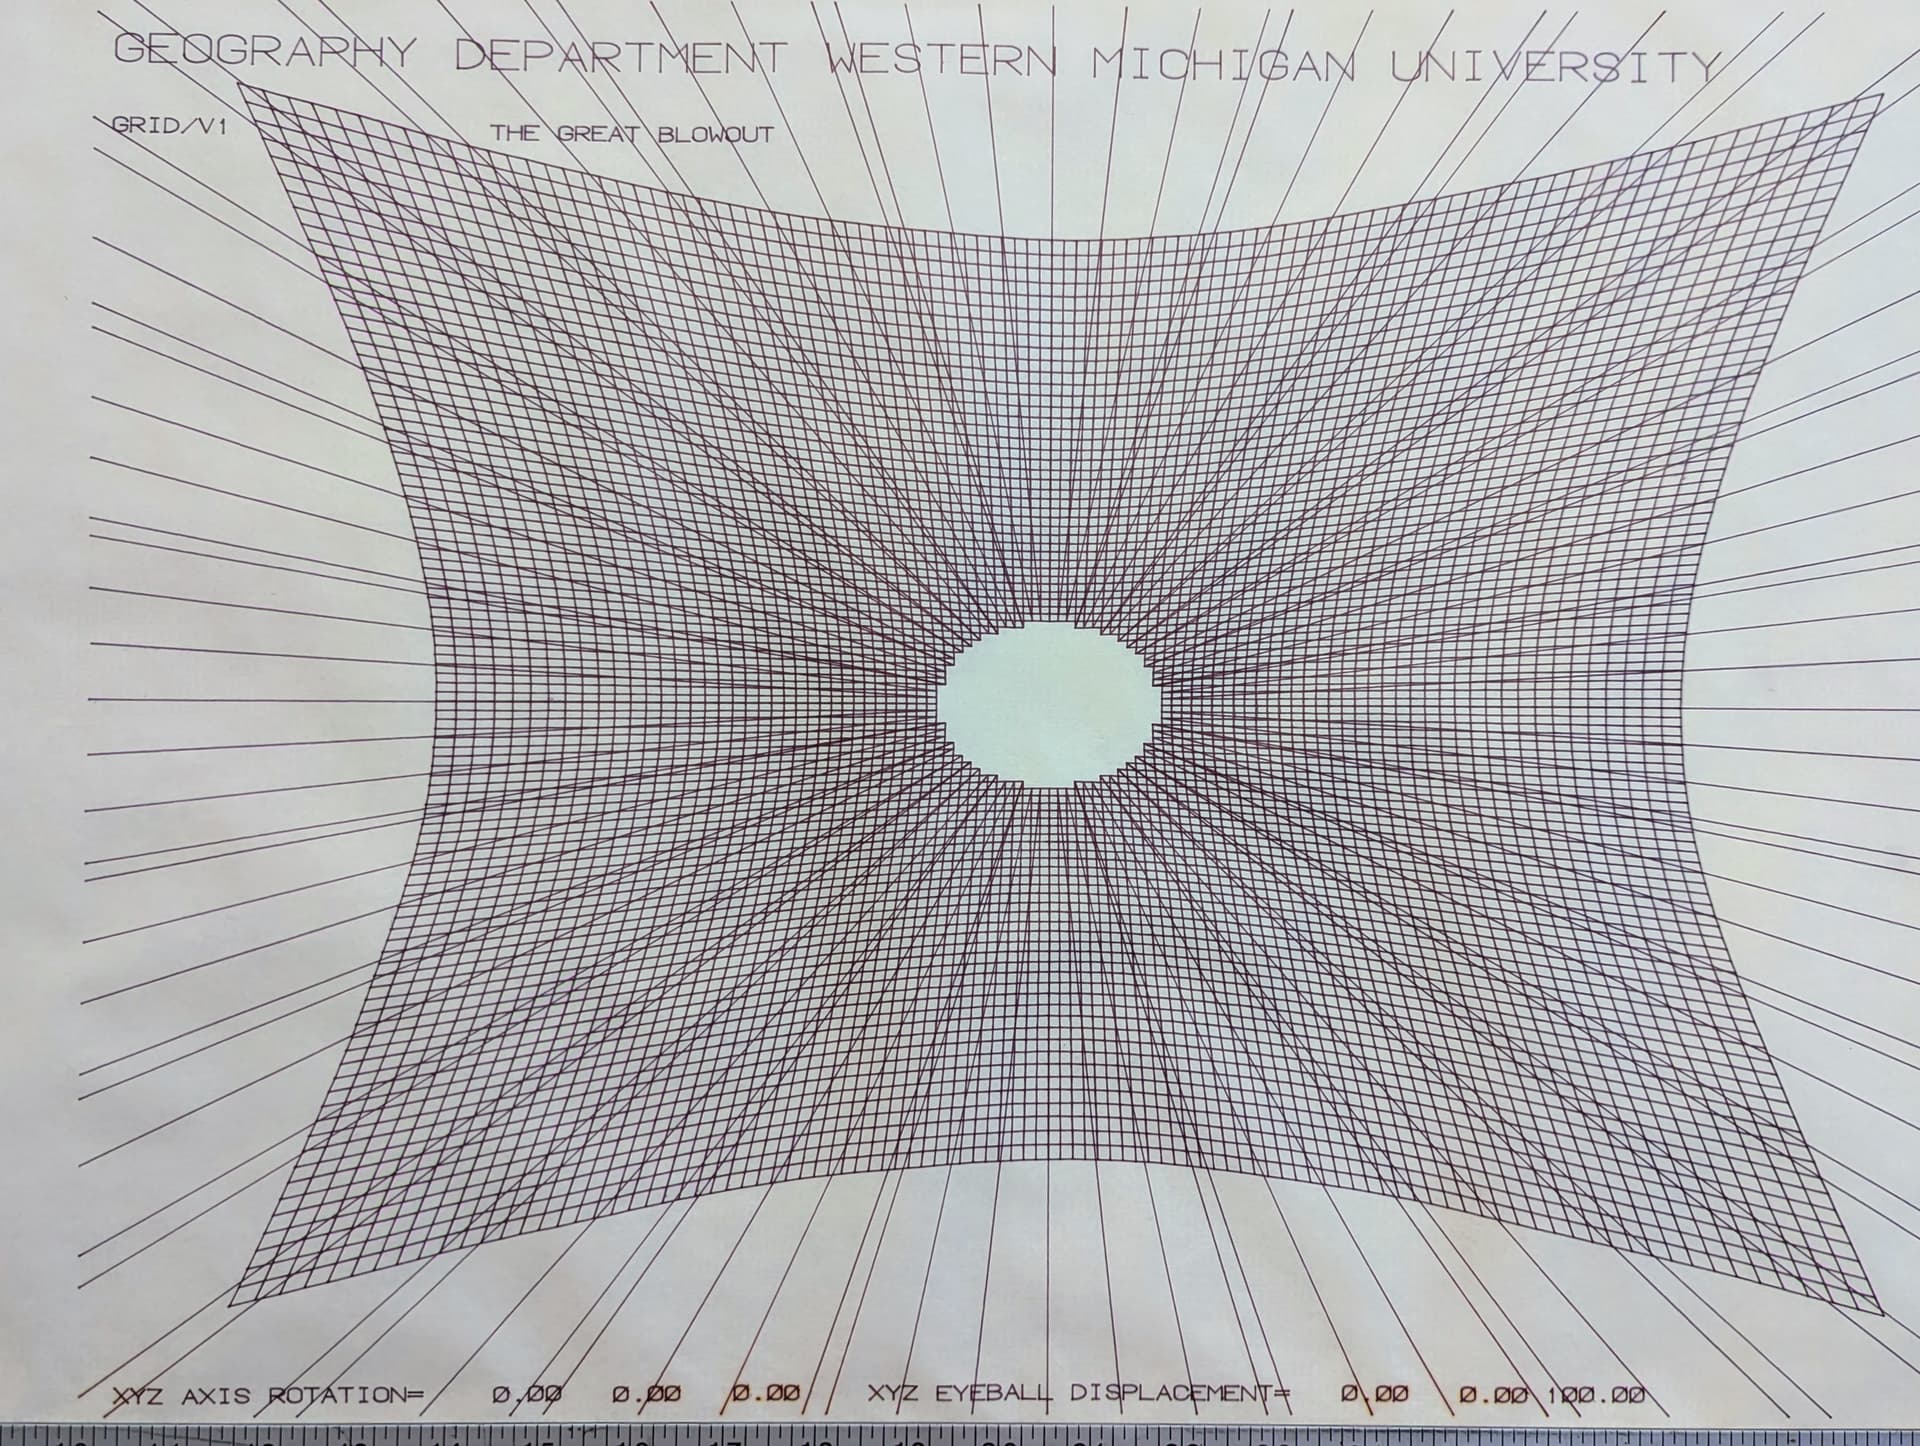
This graphic came with the equipment purchased by the Geography Department. The edge of the paper is shows the source was Tektronix, Beaverton Oregon. I would later work for Tektronix and travel to Beaverton, for support of their CAD tools relating to digital signal processing.